KeywordsCarbonated beverage Consumption Low-calorie Serving options Sugar-free University students
JEL Classification D12
Acknowledgments:
The authors are grateful to Professor R. G. Chadwick and Dr. A. G. Mason form The University of Dundee, UK for valuable comments and stimulating discussions.
Full Article
1. Introduction
People usually wish to experience a refreshing taste when consuming a beverage hence the ever-increasing popularity of fizzy drinks. This special taste is due to the presence of a variety of acids that possess low acidity levels. Citric, phosphoric, malic, ascorbic, lactic, tartaric, succinic and carbonic acids can all be found either singly or in combination in carbonated beverages that are available to today’s consumers (Parry, Shaw, Arnaud and Smith, 2001).
Carbonated drinks refer to drinks that are made predominantly from carbonated water to which juice or flavourings have been added. Carbonated beverages have carbonic acid formed by dissolving carbon dioxide in the solution hence the name ‘carbonated’ (Kitchens & Owens, 2007). These are distinct from naturally carbonated beverages.
Early agricultural communities may have made different juices by squeezing fruits (Wolf, Bray and Popkin, 2008). Although the early history of juice is hard to investigate, it has been speculated that the first modern juice may have been lemonade. The earliest English reference to lemonade was in 1663 which, though thought to be quintessentially English, actually originated in Italy making its way to England via France (Emmins, 1991).
It’s well known nowadays that citrus juices prevent scurvy as a result of their vitamin-C content. As late as the sixteenth century, this information was unknown until the value of juice was recognized by Elizabethan seamen (Emmins, 1991). However, it took until the 1790s that the medicinal value of lemon juice in treating scurvy was officially recognized. As a result, grog (rum, lime juice, water and sugar) became by law a part of the seaman’s diet (Emmins, 1991). This tradition was upheld until 1970 by the Royal Navy when its issue was discontinued as the Royal Navy had much sophisticated equipment and weaponry on board and needed sober sailors to operate it (Eschner, 2017).
Artificially carbonated water was first created in the late 1760s. It was first sold to the public by Thomas Henry, a Manchester apothecary in the 1770s. He made it by combining mineral salts, carbon dioxide gas and water (Emmins, 1991; Wolf et al., 2008). Its production was stimulated by the desire to make naturally carbonated waters by replication more readily available to the population for reasons of health promotion and no doubt profit. Initially distilled water was infused with carbon dioxide (Priestley, 1772) but later this approach was improved and commercialized by Jacob Schweppe who began selling seltzer in Geneva in 1789 and then established factory scale production in London in 1792. Surprisingly, it was not before 1833 that the first reference to effervescent lemonade, made from this product, is found (Emmins, 1991; Wolf et al., 2008).
Although the fizzy drink Dr. Pepper had been in existence since 1885 and has the distinction of being able to be served hot; a landmark in the history of soft drinks was when J.S Pemberton created Coca-cola® in 1886 by combining kola (a caffeine-containing fruit from Africa) with coca (the parent plant of cocaine). Pepsi, its modern-day rival, appeared in 1896 (Emmins, 1991; Wolf et al., 2008).
The European Food Safety Authority recommends drinking adequate amounts of water of 2L for females and 2.5L a day for males (EFSA, 2010). A huge variety of soft drinks are available, that consist mainly of water, rendering them adequate for hydration making this target relatively easy and convenient for the consumer to achieve. Consequently, more than 5 million liters of carbonated drinks were sold in the UK in 2018 with an estimated value of around 6 billion pounds sterling (BSDA, 2019).
The objective of this work was to examine carbonated beverage consumption among UK university students and assess the current beliefs concerning the personal carbonated beverage consumption and preferences namely beverage choice, method of drinking, serving temperature, quantity and rate of drinking.
2. Methodology
An online questionnaire along with a covering letter was designed for distribution to those University of Dundee students who expressed a wish to participate in the study according to the guidelines of Lumsden (Lumsden, 2007). Before the final submission, the questionnaire was piloted upon and discussed with a convenience sample of relevant respondents (i.e. University of Dundee postgraduate students) to maximize the clarity of the questionnaire. For intra-respondent reliability another convenience sample of University of Dundee postgraduate students was given the questionnaire again within 2 weeks. The reliability of these responses was assessed by calculating the Kappa statistic.
The questionnaire was constructed using an online survey service tool (Bristol Online Surveys) (Appendix). Potential participants were sought from all University of Dundee students by the weekly email they receive advertising events in that institution (University of Dundee SOMiS Hermes-II email distribution system). This contained a link to the project that gave information on what it entailed. Statistical analysis of the responses was undertaken using Prism (GraphPad Prism 8, GraphPad Software Inc., San Diego, USA).
3. Results
Prior to administration of the actual questionnaire its reliability was assessed upon a convenience sample where a reliability of 0.961 was obtained (weighted Kappa) when administered to 6 subjects on two occasions (Table 1).
Table 1. Weighted Kappa for participants of the questionnaire (N=6)
| Weighted Kappa (Linear weights) | 0.961 |
| Standard error | 0.014 |
| 95% CI | 0.933 to 0.989 |
Potential participants were sought from all University of Dundee students by the weekly email they receive advertising events in that institution; therefore, a return rate could not be calculated. However, the invitation to participate was made and sent weekly over seven-consecutive weeks by this medium.
In response to the invitation to complete the online questionnaire a total of 303 responses were received from University of Dundee students (132 males and 171 females). The mean age of respondents was 22.8 ± 4.7 (min 17 and max 43). Such a convenient number of respondents is reflected by the fact that younger respondents (in this case: university students) tend to prefer online-based questionnaires over all other forms as a method for completing and responding to a questionnaire (Lusk, Delclos, Burau, Drawhorn and Aday, 2007; Suh, 2013; Ward, Clark, Zabriskie and Morris, 2014).
Two products from the Coca-cola® Company and one product from the A.G. Barr Company were foremost, as the most preferred drinks among respondents. Coca-Cola® was the most preferred beverage among respondents (35.3%) followed by Irn Bru® (15.5%) and Sprite® (9.9%) (Table 2). Only the difference between males versus females in terms of Coca-Cola® preference was found to be statistically significant (α=0.05) with significantly more males preferring this drink than females. This agrees with a recent market report that states that the Coca-cola® Company is currently the leading soft drinks market shares in the United Kingdom with 59.3% of market’s share volume while the A. G. Barr company accounts for a further 3.4%, as the third largest in the UK and the second in Scotland (Marketline, 2015). Which also goes in line with the figures reported by the British soft drink association where Cola was found to be the most preferred flavour in the UK in 2018 (55.8%) (BSDA, 2019). Overall, about one tenth of the respondents consumed a carbonated beverage at least once a day while the majority (53%) and (30%) consumed respectively a carbonated beverage once and twice a week (Figure 1). Comparable figures were reported in previous studies that surveyed soft drink consumption among Norwegian adolescents (Bere, Glomnes, te Velde and Klepp, 2008) and American adolescents (Kassem, Lee, Modeste and Johnston, 2003;Kassem and Lee, 2004). However, a questionnaire of oral health habits undertaken among Australian athletes (Sirimaharaj, Messer and Morgan, 2002) reported a higher percentage of respondents (28.3%) who consumed a soft drink once or more a day.
Table 2. Carbonated beverage preference among respondents. Confidence Interval (α=0.05).
| Overall Mean % | Mean % | Upper Limit % | Lower Limit % | Mean % | Upper Limit % | Lower Limit % | |
| Coca-Cola | 35.3 | 43.1 | 48.7 | 37.6 | 29.1 | 34.5 | 24.3 |
| Irn Bru | 15.5 | 12.2 | 16.3 | 9.0 | 18.2 | 23.0 | 14.3 |
| Sprite | 9.9 | 9.9 | 13.7 | 7.0 | 9.9 | 13.8 | 7.0 |
| Fanta | 8.9 | 5.3 | 8.4 | 3.3 | 11.6 | 15.7 | 8.5 |
| Pepsi | 8.9 | 10.5 | 14.5 | 7.6 | 7.6 | 11.2 | 5.1 |
| 7-Up | 4.6 | 3.9 | 6.8 | 2.3 | 5.3 | 8.4 | 3.3 |
| Appletiser | 4.6 | 3.0 | 5.5 | 1.6 | 6.0 | 9.2 | 3.8 |
| Dr. Pepper | 3.6 | 3.9 | 6.8 | 2.3 | 3.6 | 6.4 | 2.0 |
| Schweppes | 3.3 | 2.3 | 4.7 | 1.1 | 4.0 | 6.8 | 2.3 |
| Mountain Dew | 1.3 | 2.3 | 4.7 | 1.1 | 0.7 | 2.4 | 0.1 |
| Shloer | 1.3 | 0.7 | 2.4 | 0.1 | 1.7 | 3.8 | 0.7 |
| Grapetiser | 1.3 | 0.7 | 2.4 | 0.1 | 1.7 | 3.8 | 0.7 |
| Tango | 1 | 1.6 | 3.8 | 0.7 | 0.7 | 2.4 | 0.1 |
| Barr Cola | 0.3 | 0.7 | 2.4 | 0.1 | 0.0 | 1.3 | 0.0 |
| Tizer | 0 | 0.0 | 1.2 | 0.0 | 0.0 | 1.3 | 0.0 |
Notes: *Coca-Cola has a confidence interval lower boundary that is higher than 6.67% (1/15), which is the threshold for chance. Moreover, the error bars for male Coca-Cola preference group don’t overlap with female Coca-Cola preference group, meaning more males would select Coca-Cola than females (α=0.05).
The annual consumption of soft drinks in the UK is 206.2 litres per person, of these carbonated drinks are the most consumed soft drinks. These account for 38% of total individual fluid consumption. As for carbonated drinks, the UK annual consumption per head of population, is around 79.2 litres. These figures indicate that carbonated drink consumption among the UK population was in excess of one fifth of a litre per day in 2016 (based on the amount per capita of drinks sold for human consumption therefore non-consumers could not be excluded).
Outwith the UK, much higher consumption volumes were found in a report assessing carbonated drinks consumption in the US among 13- to 18-year olds, where the consumption rate of carbonated drinks was surveyed and subsequently analysed (Jacobson, 2005). The mean consumption rate among males was found to be 710 ml per day and among females 483 ml per yielding an overall consumption of 597 ml per day. These figures, although higher than the ones reported in this current UK-based work, were comparable to those of another US-based study that surveyed the consumption of carbonated drinks among different age groups (Popkin, 2010).
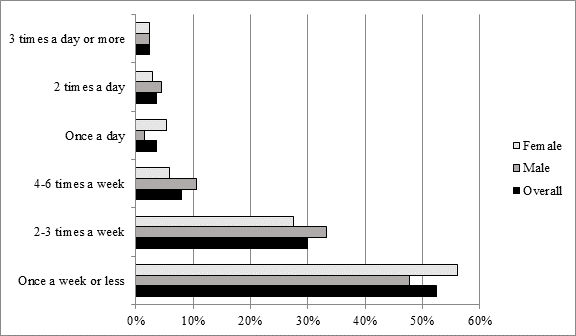
Figure 1. Frequency of carbonated beverage consumption among respondents
Most respondents consumed their beverages with food, at parties and in cinemas (69%, 56% and 40% respectively) but some other occasions came to light for this activity as shown in figure 2. 37% of respondents consumed soft drinks as mixers for hard drinks, this coincides with the findings reported in Scotland that people were quite commonly having soft drinks with hard drinks as mixers (Syed, 2007).
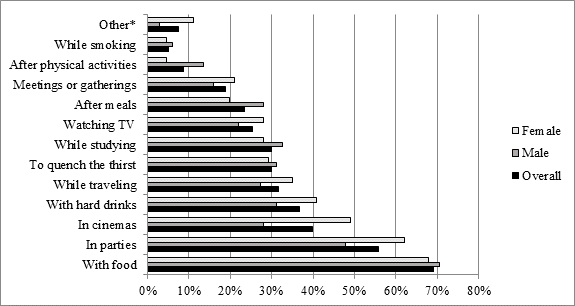
*other included (overall percentage): when hungover (1.3%), at work (1.3%), during picnics (1%), first thing in the morning (1%) and as a treat (1%).
Figure 2. Carbonated beverage consumptions times
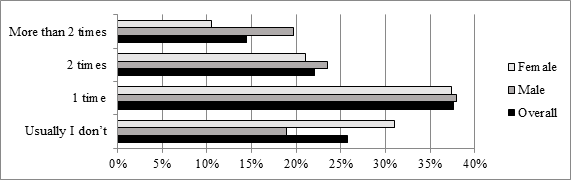
As regards the amount of consumption per occasion, about three quarters of respondents consumed 1 can or equivalent per drinking episode and one fifth of them consumed 2 cans or equivalent (Figure 3). 6.6% of respondents consumed more than 2 cans per drinking episode. When having a meal in a restaurant for instance, about three quarters of the respondents indicated that they would refill their drinks at least once (Figure 4). Females were more inclined not to refill their drink compared to males. Chi-square statistical analysis found this difference to be statistically significant (P<0.05).
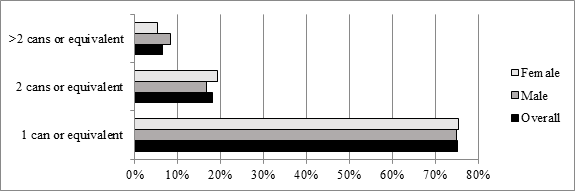
Figure 3. Quantity of consumption per time
| χ2 test | Refill | No Refill | Total |
| Male | 246 | 57 | 303 |
| Female | 209 | 94 | 303 |
| Total | 455 | 151 | 606 |
Chi squared equals 12.08 with 1 degrees of freedom (P value 0.0005).
The association between gender and the tendency to refill is considered to be statistically significant (P < 0.05).
Figure 4. Frequency of refilling a carbonated beverage while having a meal in a restaurant
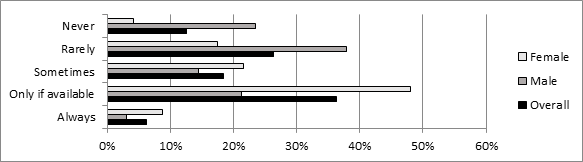
The responses demonstrated a higher tendency for females to use a straw to consume a carbonated beverage in comparison to males (Figure 5). Chi-square statistical analysis showed that this difference was statistically significant (P<0.05). A different outcome was obtained from a survey conducted among adolescents in Nigeria where 42% claimed to drink with a straw (Tokumbo, Oluniyi, Adebanke and Ozovehe, 2014). This might be attributed to the different age group surveyed herein.
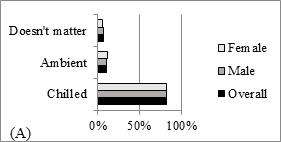
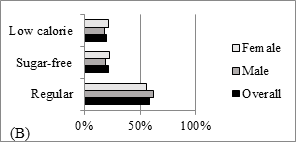
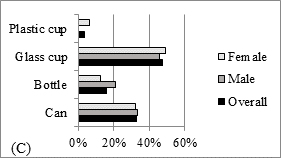
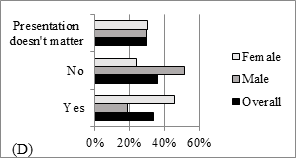
The questionnaire offered the respondents several ‘ideal’ serving options to choose from, under different categories namely: temperature, dietary requirements, presentation and the use of straw, and were asked to choose the option/s they most preferred (Figure 6). The majority of respondents chose a chilled, regular drink poured in a glass cup. Among those who chose ‘bottle’; a higher percentage of male respondents was found. On the contrary, among those who chose ‘plastic cups’ none were males. These differences were found by Chi-square to be statistically significant P = 0.0033 and P < 0.0001 respectively. Moreover, females were found to be pickier in terms of how their drinks were presented with 46 % of females stating that presentation does matter while only 19 % of males stated so. This difference was found to be very highly statistically significant (P < 0.0001) (Chi-square).
According to the British soft drink association, 54.5% of carbonates sold in 2018 were low-calorie and no-added-sugar variants (BSDA, 2019). However, the results of this work reported the consumption of regular beverages more than low-calorie and sugar-free beverages which is in line with other findings (Kassem et al., 2003; Kassem & Lee, 2004; Bere et al. 2008) (Figure 6).
From the foregoing results of this work, university students in the UK were not as keen on consuming carbonated beverages as in other parts in the world. Nevertheless, they appeared to prefer regular Coca-Cola®, served chilled in a glass cup. They also reported that this occurred once or twice a week, usually over a meal or in parties.
| χ2 test | May use a straw | No Straw | Total |
| Male | 232 | 71 | 303 |
| Female | 291 | 12 | 303 |
| Total | 523 | 83 | 606 |
Notes: Chi squared equals 8.661 with 1 degrees of freedom (P value <0.0001)
The association between gender and straw preference is considered to be statistically significant (P < 0.05).
Figure 5. Frequency of using a straw upon consumption of a carbonated beverage
| χ2 test | Bottle | No Bottle | Total |
| Male | 64 | 239 | 303 |
| Female | 37 | 266 | 303 |
| Total | 505 | 606 | 606 |
Chi squared equals 48.60 with 1 degrees of freedom (P value 0.0033)
The association between gender and bottle preference is considered to be statistically significant (P < 0.05).
| χ2 test | Plastic Cup | No Plastic Cup | Total |
| Male | 0 | 303 | 303 |
| Female | 19 | 284 | 303 |
| Total | 19 | 587 | 606 |
Chi squared equals 19.61 with 1 degrees of freedom (P value <0.0001)
The association between gender and plastic cup preference is considered to be statistically significant (P < 0.05).
| χ2 test | Presentation matters | Presentation doesn’t matter | Total |
| Male | 57 | 156 | 213 |
| Female | 138 | 73 | 211 |
| Total | 195 | 229 | 424 |
Chi squared equals 63.72 with 1 degrees of freedom (P value <0.0001)
The association between gender and presentation is considered to be statistically significant (P < 0.05).
Figure 6. Ideal serving options for a carbonated drink (a) Temperature (b) dietary requirements (c and d) presentation
4. Conclusion
From the foregoing results of this work, it is clear within the limitations of the sample that; The Coca-Cola® company is currently the leading soft drink manufacturer. One tenth of the respondents are consuming a carbonated beverage at least once a day, among which one third consume at least two cans per drinking episode. Interestingly, however, the way drinks are presented seems to be of great significance to females.
This study shows that the current beliefs and preferences concerning the personal carbonated beverage consumption all seem to be important to explain current consumption trends in a population. Carbonated beverage manufacturers can incorporate the findings of this work into future broader studies in order to better understand the market and the customer.
Appendix - Questionnaire items and selection options.
|
1 |
Date of birth Selection options: Calendar date selector |
|
2 |
Sex Selection options: Male, Female |
|
3 |
Generally, which of the following soft drinks would be your first choice? Selection options: Coca Cola, Sprite, Fanta, Irn Bru, Barr Cola, Tango, Pepsi, 7-Up, Dr. Pepper, Tizer, Mountain Dew, Schweppes Lemon, Shloer, Grapetiser, Appletiser |
|
4 |
How often do you consume this drink? Selection options: once a week or less, 2-3 times a week, 4-6 times a week, once a day, 2 times a day, 3 times a day or more |
|
5 |
How much do you consume each time? Selection options: 1 can or equivalent, 2 cans or equivalent, More than 2 cans or equivalent |
|
6 |
Which of the following soft drinks would be your second choice? Selection options: Coca Cola, Sprite, Fanta, Irn Bru, Barr Cola, Tango, Pepsi, 7-Up, Dr. Pepper, Tizer, Mountain Dew, Schweppes Lemon, Shloer, Grapetiser, Appletiser |
|
7 |
How often do you consume this drink? Selection options: once a week or less, 2-3 times a week, 4-6 times a week, once a day, 2 times a day, 3 times a day or more |
|
8 |
How much do you consume each time? Selection options: 1 can or equivalent, 2 cans or equivalent, More than 2 cans or equivalent |
|
9 |
Which of the following soft drinks would be your third choice? Selection options: Coca Cola, Sprite, Fanta, Irn Bru, Barr Cola, Tango, Pepsi, 7-Up, Dr. Pepper, Tizer, Mountain Dew, Schweppes Lemon, Shloer, Grapetiser, Appletiser |
|
10 |
How often do you consume this drink? Selection options: once a week or less, 2-3 times a week, 4-6 times a week, once a day, 2 times a day, 3 times a day or more |
|
11 |
How much do you consume each time? Selection options: 1 can or equivalent, 2 cans or equivalent, More than 2 cans or equivalent |
|
12 |
When do you usually consume soft drinks? Selection options: with food, after meals, while travelling, after sports or certain physical activities, in parties, to quench the thirst, with hard drinks, while smoking, during meetings or gatherings, in cinemas, watching tv, studying, other |
|
13 |
How often would you use a straw while drinking? Selection options: Always, Only if available, Sometimes, Rarely, Never |
|
14 |
How many times do you refill your drink in a restaurant? (consider that refills are free) Selection options: Usually I don't, 1 time, 2 times, More than 2 times |
|
15 |
"While having a meal.." What type of the aforementioned soft drinks would you most likely choose? Selection options: Coca Cola, Sprite, Fanta, Irn Bru, Barr Cola, Tango, Pepsi, 7-Up, Dr. Pepper, Tizer, Mountain Dew, Schweppes Lemon, Shloer, Grapetiser, Appletiser |
|
16 |
What would be the ideal serving temperature for your chosen drink? Selection options: Chilled, Ambient "room temperature", Doesn't matter |
|
17 |
What would be the ideal serving options for your chosen drink? Selection options: Regular, Sugar-free "No added sugar", Diet "Low calorie" |
|
18 |
How would you like your drink to be served in? Selection options: Can, Bottle, Glass cup, Plastic cup |
|
19 |
Would you always prefer your beverage to be presented according to your answers above? Selection options: Yes, Presentation doesn't matter |
References
- Bere, E., Glomnes, E. S., te Velde, S. J. and Klepp, K. I., 2008. Determinants of adolescents’ soft drink consumption. Public health nutrition, 11(1), pp. 49-56. doi:10.1017/S1368980007000122
- BSDA British Soft Drinks Association, 2019. The UK soft drinks annual report 2019. London: Zenith International. [online] Available at: http://www.britishsoftdrinks.com [Accessed 12 April 2020].
- EFSA Panel on Dietetic Products, Nutrition, and Allergies (NDA), 2010. Scientific opinion on dietary reference values for water. EFSA Journal, 8(3), pp. 1459. doi:10.2903/j.efsa.2010.1459
- Emmins, C., 1991. Soft Drinks: Their Origins and History. Buckinghamshire: Shire Publications Ltd.
- Eschner, K., 2017, July. Reasons why the royal navy bribed sailors with booze. Smithsonian Magazine. [online] Available at: https://www.smithsonianmag.com/smart-news/reasons-why-royal-navy-bribed-sailors-booze-180964223/ [Accessed 12 April 2020].
- Jacobson, M. F., 2005. Liquid candy: how soft drinks are harming Americans' health. Washington, DC: Center for Science in the Public Interest. [online] Available at: https://cspinet.org/resource/liquid-candy-report [Accessed 12 April 2020].
- Kassem, N. O. and Lee, J. W., 2004. Understanding soft drink consumption among male adolescents using the theory of planned behavior. Journal of Behavioral Medicine, 27(3), pp. 273-296. doi:10.1023/B:JOBM.0000028499.29501.8f
- Kassem, N. O., Lee, J. W., Modeste, N. N. and Johnston, P. K., 2003. Understanding soft drink consumption among female adolescents using the Theory of Planned Behavior. Health Education Research, 18(3), pp. 278-291. doi:10.1093/her/cyf017
- Kitchens, M. and Owens, B., 2007. Effect of carbonated beverages, coffee, sports and high energy drinks, and bottled water on the in vitro erosion characteristics of dental enamel. Journal of Clinical Pediatric Dentistry, 31(3), pp. 153-159. doi:10.17796/jcpd.31.3.1157l653t8206100
- Lumsden, J., 2007. Online-questionnaire design guidelines. In R. A. Reynolds, R. Woods and J. D. Baker (Eds.), Handbook of research on electronic surveys and measurements (pp. 44-64). Hershey, PA: Idea Group. doi:10.4018/978-1-59140-792-8.ch005
- Lusk, C., Delclos, G. L., Burau, K., Drawhorn, D. D. and Aday, L. A., 2007. Mail versus internet surveys: determinants of method of response preferences among health professionals. Evaluation & the Health Professions, 30(2), pp. 186-201. doi:10.1177%2F0163278707300634
- Marketline., 2015. Carbonated Soft Drinks in the United Kingdom: Industry Profile. Report No. OHMF1186. London: Progressive Digital Media Ltd. [online] Available at: https://store.marketline.com/report/ohme3197--carbonated-soft-drinks-in-the-united-kingdom/ [Accessed 12 April, 2020].
- Parry, J., Shaw, L., Arnaud, M. J. and Smith, A. J., 2001. Investigation of mineral waters and soft drinks in relation to dental erosion. Journal of Oral Rehabilitation, 28(8), pp. 766-772. doi:10.1046/j.1365-2842.2001.00795.x
- Popkin, B. M., 2010. Patterns of beverage use across the lifecycle. Physiology & behavior, 100(1), pp. 4-9. doi:10.1016/j.physbeh.2009.12.022
- Priestley, J., 1772. Directions for impregnating Water with Fixed Air; In order to communicate to it the peculiar Spirit and Virtues of Pyrmont water, And other Mineral Waters of a similar nature. London: J. Johnson.
- Sirimaharaj, V., Messer, L. B. and Morgan, M. V., 2002. Acidic diet and dental erosion among athletes. Australian Dental Journal, 47(3), pp. 228-236. doi:10.1111/j.1834-7819.2002.tb00334.x
- Suh, J. H., 2013. A Comparison of Mail and Internet Survey Procedures. In E. Gomez (ed.) Proceedings of the 2013 Northeastern Recreation Research Symposium. Newtown Square, PA: U.S. Department of Agriculture, Forest Service, Northern Research Station. [online] Available at: https://scholarworks.umass.edu/cgi/viewcontent.cgi?article=1046&context=nerr [Accessed 12 April 2020].
- Syed, J., 2007. Determination and modification of drink erosive factors. Doctoral dissertation, University of Dundee, Dundee, UK.
- Tokumbo, B. C., Oluniyi, O. A., Adebanke, K. K. and Ozovehe, P. A., 2014. Beverages drinking habits and tooth sensitivity experience among adolescent secondary school students. Journal of Research in Dentistry, 2(2), pp. 150-158. doi:10.19177/jrd.v2e22014150-8
- Ward, P., Clark, T., Zabriskie, R. and Morris, T., 2014. Paper/pencil versus online data collection: An exploratory study. Journal of Leisure Research, 46(1), pp. 84-105 doi:10.1080/00222216.2014.11950314
- Wolf, A., Bray, G. A. and Popkin, B. M., 2008. A short history of beverages and how our body treats them. Obesity Reviews, 9(2), pp. 151-164. doi:10.1111/j.1467-789X.2007.00389.x
Article Rights and License
© 2020 The Authors. Published by Sprint Investify. ISSN 2359-7712. This article is licensed under a Creative Commons Attribution 4.0 International License.