Keywordsbrand association brand awareness brand concept customer loyalty occupational health clinic perceived quality
JEL Classification M30
Full Article
1. Introduction
The number of healthcare facilities in Indonesia in 2023 was found to be 17,953 units. According to the 2021 data from Indonesian Statistic, there were 11,874 healthcare facilities, indicating an increase of 33,8% compared to the previous two year (Kemenkes, 2024). Supported by the regulation of the Indonesian Ministry of Manpower, all companies must conduct periodic health examination for employees at least once a year, which can appoint one or several providers to assist companies that are unable to independently conduct periodic health examination (Permenaker, 1980).
In Batam city itself, there are 183 clinics (Sekretariat Satu Data Kota Batam, 2023). The healthcare industry has undergone significant changes, placing considerable pressure on healthcare facilities to not only survive, but also thrive. The private healthcare sector is experiencing rapid growth in developing countries, intensifying competition within the healthcare industry. This competitive environment requires healthcare facilities to actively compete for a larger market share. Conversely, customers have the freedom to choose their healthcare providers. In a competitive situation, success in the healthcare sector depends not only on technical proficiency and the delivery of high-quality services, but also on customer satisfaction and the encouragement of repeat business. Customer loyalty is recognized as the key factor for the success of healthcare facilities (Zhou et al., 2017). This forces us to find new innovations to develop healthcare facilities. Innovations can generate different or new market offerings, providing substantial value to healthcare facilities if successfully adopted in the market (Kanagal, 2015).
If previously the evaluation of healthcare facility performance predominantly relied on fatality and morbidity rates, there is currently a shift in customer expectations. Assessment now revolves around customers, involving quality, satisfaction, and choice. However, many healthcare facilities have not yet achieved this. One contributing factor is their emphasis on enhancing healthcare service quality, primarily through investments in advanced medical equipment, rather than implementing sustainable mechanisms for quality improvement integrated into clinical management. Ensuring the quality of services offered is crucial for healthcare facilities, as it not only facilitates the continuity of operations but also plays a pivotal role in elevating brand equity (Warsewicz, 2022).
Brand equity reflects perceived value as seen through customers’ side, so healthcare facilities need to build a platform for customer relationships. This can evoke positive emotions towards the healthcare facility and ensure a place in the hearts of customers. It will also strengthen customer trust and enhance prestige in the eyes of customers due to the high interaction between customers and healthcare service providers. Brand equity can boost credibility, trust, and customer loyalty. A deeper understanding of brand equity can help enhance customer loyalty and, consequently, generate profits (Warsewicz, 2022). Another crucial determinant of customer loyalty is the ability to choose a brand concept. The brand concept is the chosen brand image that aligns with customer needs and is the result of various dimensions of brand equity. A strong brand relationship reflects customer loyalty through emotional bonds and commitment (Jeon, 2017).
For healthcare facilities, customer loyalty is highly important. Loyal customers contribute to economic value and are valuable assets as they exhibit loyalty characteristics by consistently reusing specific services, referring others, and demonstrating resilience against competitors. Briefly, a reciprocal relationship forms between healthcare facilities and loyal patients (Aladwan et al., 2021). Loyalty can provide benefits to both customers and companies. From customer loyalty, it is known that attracting new customers is more expensive than retaining existing ones (Magatef et al., 2015). Brand equity and brand concept can drive clinics in building a brand that can be used as a strong marketing strategy and have a positive impact on customer loyalty.
Based on the statement above, it is clear that customer loyalty indicators have undergone changes and are focused around the customers themselves. Healthcare facilities that can adapt may be more resilient in the midst of competition. Healthcare facilities need to find ways to stay connected with customers. The problem is that many healthcare facilities have not yet utilized brand equity dimensions and brand concept as one of the marketing strategies to maintain and or enhance their businesses. Therefore, the objective of this research is to analyze the influence of brand equity dimensions and brand concept on customer loyalty.
The results of this research are beneficial for healthcare facilities in understanding the brand equity dimensions and brand concept that influence customer loyalty, thereby strengthening preferences, interest, and the desire to use healthcare services. Meanwhile, from the customer’s perspective, it is beneficial in making decisions to choose qualified healthcare services, understanding and fulfilling health needs.
2. Literature Review
2.1. Definition of Key Concepts
Customer Loyalty
Loyalty is a profound commitment of customers to persist in engaging or selecting a particular healthcare provider, even when alternatives exist. Loyal customers provide measurable benefits not only because they return to repurchase when in need of healthcare services but also because they act as independent marketing agents. They recommend their choices by recommending them to friends, relatives, neighbors, or others in their social circle (Chang et al., 2013).
Customer loyalty is a situation in which repurchase behavior is accompanied by psychological attachment (Shamsudin et al., 2015). In another view, customer loyalty combines behavioral and attitudinal factors into a single composite construct. Customer loyalty indicates a tendency for repeated usage of a specific service, a positive attitude toward the service, and a consideration to only use the service when a need arises. The level of customer loyalty can be measured by how willing customers are to recommend and provide positive testimonials about a product or service to their friends and family (Abdelfattah et al., 2015). Customer loyalty is the behavior exhibited by customers towards a brand, service, store, activity, and product category. Loyalty is the customer’s desire to reuse a specific service. Indicators of customer loyalty are adopted from prior research (Karim et al., 2022). In this study, customer loyalty will represent the dependent variable. The dependent variable (outcome variable) is a variable that depends on the independent variable (Apuke, 2017).
Brand Awareness
Brand awareness is regarded as a fundamental stage in the communication process between companies and customers, which needs to take place before all other steps in that process. In this context, brand awareness emerges as the pivotal factor influencing customer behavior and shaping brand preferences. The objective of brand awareness is to establish initial communication with the customer, ensuring that the brand consistently holds a prominent place in the customer’s consideration after the initial contact. Brand awareness goes beyond mere recognition of the brand name or having encountered it before; it signifies the customer’s ability to associate the name, logo, and similar connotations in their mind (Pilehvarian et al, 2015).
Customers often choose well-known brands because they perceive a sense of safety and comfort with the familiar. In essence, a brand’s familiarity implies a likelihood of reliability, business stability, and proven quality. Consequently, a customer with brand awareness can effortlessly decipher brand elements without external assistance (Wijaksono et al., 2019).
Brand Association
Brand association can be established through connections with attitudes, attributes, and benefits. Additionally, brand association serves as a tool for gathering information, enabling brand differentiation and extension. Further argues that highly effective associations contribute to enhancing brand equity (Severi et al., 2013). Brand association is everything related to the memory of a brand or every impression that arises in someone’s mind that related to his memory of a brand (Syukri, 2018).
Perceived Quality
Perceived quality is defined as the customer’s judgment of the overall excellence or superiority of the service. In this context, quality is viewed as a comprehensive assessment, contributing to customer loyalty when positively appraised, regardless of whether it pertains to a service, product, or brand (Loureiro, 2013).
Perceived quality is crucial for customers in choosing the goods and services they will purchase. It is important to note that product quality is a vital corporate resource for achieving competitive advantage. Compared to its substitutes, it is known that perceived quality is the product’s ability to be acceptable in providing satisfaction when relatively compared to available alternatives. High perceived quality indicates that customers have recognized the differences and advantages of the product compared to similar products after a prolonged period (Rutinaias et al., 2020). Indicators of brand awareness, brand association, and perceived quality are adopted from prior research (Lee et al., 2023). Independent variable (experimental variable or predictor variable) is a variable being manipulated in a study to observe its effects on the dependent variable (Apuke, 2017).
Brand Concept
Brand concept is defined as the meaning of the brand chosen by the company based on customer needs. As a concept, the brand has existed for a long time as a way to distinguish products or services from a particular company. Indicators of the brand concept are adopted from prior research (Jeon, 2017).
2.2. Research Hypotheses
Brand awareness is defined as customer’s ability to recognize a specific brand. In another definition, brand awareness is the knowledge and ability to recall a product or service by customers. The most important step in building brand equity is to establish awareness (Roy et al., 2018).
The dimensions of brand awareness significantly influence the assessment of brand equity, which in turn affects customer loyalty. This is supported by research (Asriani et al., 2019; Mukaram et al., 2018; Armadani et al., 2018), stating that brand awareness has an impact on the use of healthcare services in hospitals. Similarly, in a study by (Razak et al., 2019), brand awareness has a positive relationship with the intention to repurchase. Customers tend to purchase services with brands they are already familiar with rather than those that are unfamiliar to them. The impact of brand awareness lies in brand selection, frequency, and brand trials. Attitudes towards the brand cannot form, and the interest to purchase will not emerge unless brand awareness is already established in their minds.
H1: Brand awareness significantly influences customer loyalty.
Brand association reflects all the memories associated with a brand, which is also a bundle of experiences that come to mind related to one’s memory of a specific brand (Syukri, 2018). Good brand association provides distinct characteristics to a brand. In the research conducted by (Asriani et al., 2019; Mukaram et al., 2018), there is a strong influence of brand association on the decision to choose services in hospitals. Meanwhile, according to (Sumarni, 2018), patients reuse healthcare services in hospitals because of good brand association. This is consistent with research by (Armadani et al., 2018; Nugroho et al., 2013) where customers perceive hospital brand association positively.
H2: Brand association significantly influences customer loyalty.
In the healthcare industry, receiving qualified services is the right of every customer, and providing qualified healthcare services is the ethical obligation of all healthcare facilities. Therefore, it is crucial for healthcare facilities to periodically improve service quality by paying attention to customer perceptions and expectations (Cham et al, 2014).
Perceived quality is given significant attention because of its ability to predict customer behavior, satisfaction, decision-making, and gaining competitive advantage. Research evidence indicates that customers who feel they are getting value for money are more satisfied than those who do not perceive value for money (Ashraf, 2018). The perceived quality of a service influences customer decisions to purchase that service, including their loyalty to the brand, as perceived quality determines the value of the service. Purchasing decisions and creating loyalty to a service arise from a positive impression of its quality. Conversely, if negative quality impressions arise, the service will not endure (Radansyah et al., 2021).
Good perceived quality of hospital services generate interest in reuse by customers, as found in the research by (Sumarni, 2018). Similarly, in the study by (Nugroho et al., 2013), perceived quality of hospital provides positive value.
H3: Perceived quality significantly influences customer loyalty.
It turns out that the sensory pleasure from aesthetic brands is also important in fulfilling customer needs. This aesthetic experience becomes relevant experiential aspects in marketing. Concept and visual appeal have captured customer attention and stimulated their imagination. This can have a profound impact on customer feelings, thoughts, and behavior. When customers perceive service quality as a given, aesthetics becomes a crucial criterion in purchasing decisions (Jeon, 2017).
Symbolic brands can represent a part of one’s identity. Brands have the ability to differentiate one customer from another, indirectly defining the customer’s self. Conversely, brands can also create relationships among customers who have similar interests in a service. This can bring individuals together with desired community, status, or self-image. Customers can appreciate the social status, privileges, or style of a brand because it positively relates to their identity. Brands with symbolic benefits can enhance customer interest to strive and invest their resources to remain loyal to a brand (Jeon, 2017). Brand identification is also defined as a sense of pride when they use a product or service that displays a specific logo (Eldegwy et al, 2018).
H4: Brand concept significantly influences customer loyalty.
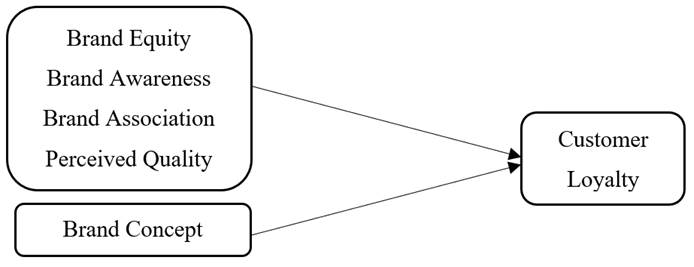
Figure 1. Conceptual Model
3. Research Methodology
Quantitative descriptive research is designed to depict the distribution of existing variables without much consideration for cause-and-effect relationships or other hypotheses (Hong et al., 2018). This study involves hypothesis testing, describing statistical data for specific purposes. Based on the research objectives, it relates to discovery—utilizing new data collected, proof—aiming to validate issues arising against specific knowledge, and utilization of data to assess and develop existing knowledge (Loeb et al., 2017). The research employs statistical testing methods, specifically multiple linear regression, to examine the statistical relationship between independent and dependent variables.
The research population comprises customers undergoing health examination in occupational health clinics located in Batam City. The chosen clinic for the study is an occupational health clinic in Batam City. Sample selection utilizes purposive sampling, aiming to provide the best information to achieve the research objectives (Etikan et al., 2017). The sample includes customers who reuse health examination services at the clinic, are willing to recommend these services to others (Wu et al., 2014; Gul, 2014), and choose one brand over a competitor’s brand (Magatef et al., 2015).
Recent developments indicate that researchers have to determine sample size through numerical analysis. This approach determines the minimum sample size by considering the portion with the highest number of predictors. It necessitates information concerning the number, effect size, and significance level to compute the minimum required sample size (Hair et al., 2018). Based on this analysis, the required sample size in this study is a minimum of 230 samples. After distributing the research questionnaire, a sample size of 232 samples was obtained.
4. Results
4.1. Sample Demographic Characteristics
The table below presents a description of sample’s characteristics.
Table 1. Sample’s Demographic Characteristics
| Gender | Number | Percentage |
| Male | 121 | 52.2 |
| Female | 111 | 47.8 |
| Total | 232 | 100.0% |
| Age | Number | Percentage |
| 17-27 Years Old | 68 | 29.3 |
| 28-39 Years Old | 77 | 33.2 |
| ≥40 Years Old | 87 | 37.5 |
| Total | 232 | 100.0% |
| Occupation | Number | Percentage |
| Housewife | 3 | 1.3 |
| Student | 8 | 3.4 |
| Entrepreneur | 15 | 6.5 |
| Private Sector Worker | 194 | 83.6 |
| Civil Servant | 11 | 4.7 |
| Retired | 1 | 0.4 |
| Total | 232 | 100.0% |
| Last completed educational cycle | Number | Percentage |
| Elementary School | 1 | 0.4 |
| Junior High School | 1 | 0.4 |
| Senior High School | 48 | 20.7 |
| Diploma Degree | 57 | 24.6 |
| Bachelor’s degree | 125 | 53.9 |
| Total | 232 | 100.0% |
| Income | Number | Percentage |
| 4,5-5 Million Rupiah | 86 | 37.1 |
| 5,1-10 Million Rupiah | 56 | 24.1 |
| >10 Million Rupiah | 90 | 38.8 |
| Total | 232 | 100.0% |
| Number of Examinations | Number | Percentage |
| 2-5 times | 163 | 70.3 |
| 6-10 times | 32 | 13.8 |
| >10 times | 37 | 15.9 |
| Total | 232 | 100.0% |
In terms of gender, the majority of the samples in this study are male, comprising 121 samples (52.2%), while the remaining 111 samples (47.8%) are female. In this study, the age of the samples is categorized into three groups: ages 17–27 years old, 28–39 years old, and ≥40 years old. Table 1 indicates that 68 samples (29.3%) including the age category of 17–27 years old, 77 samples (33.2%) including the age category of 28–39 years old, and the remaining 87 samples (37.5%) including the age category of ≥40 years old. In this study, the majority of the samples belong to the age category of ≥40 years old (37.5%). Regarding occupation, Table 1 shows 3 samples (1.3%) as housewives, 8 samples (3.4%) as students, 15 samples (6.5%) as entrepreneurs, 194 samples (83.6%) work as private sector workers, 11 samples work as civil servants, and the remaining 1 sample (0.4%) has been retired. In this study, the majority of the samples work as private sector workers (83.6%). Regarding the last completed educational cycle, Table 1 indicates that the number of research samples with a last educational background of elementary school and junior high school is 1 sample each (0.4%), senior high school is 48 samples (20.7%), diploma degree is 57 samples (24.6%), and bachelor’s degree is 125 samples (53.9%). In this study, most of the samples have completed a bachelor’s degree education (53.9%). Table 1 shows that 86 samples (37.1%) have an income of 4.5-5 million rupiah, 56 samples (24.1%) have an income of 5.1–10 million rupiah, and the remaining 90 samples (38.8%) have an income exceeding 10 million rupiah. In this study, the majority of the samples have an income greater than 10 million rupiah (38.8%).
The examination of samples is categorized into three groups: 2-5 times, 6-10 times, and more than 10 times. Table 1 shows that 163 samples (70.3%) underwent examinations 2-5 times, 32 samples (13.8%) underwent examinations 6–10 times, and the remaining 37 samples (15.9%) underwent examinations more than 10 times. In this study, the majority of the samples underwent examinations 2-5 times (70.3%).
4.2. Outlier Test Result
The Outlier test is a test used to detect extreme data so that the data is not normally distributed when normality testing is conducted. Samples identified as outliers will be excluded. A total of 232 data points was included in the outlier test. The outlier test in this study uses Z-score values. A data is considered an outlier if below -3.00 or above 3.00. In Table 2, the minimum and maximum Z-score values for each variable do not have values below -3.00 or above 3.00, indicating that no data is excluded as there are no outliers detected.
Table 2. Outlier Test Result
| Variable | Z-score | |
| Minimum | Maximum | |
| Brand Awareness | -2.612 | 1.202 |
| Brand Association | -2.683 | 1.304 |
| Perceived Quality | -2.799 | 1.212 |
| Brand Concept | -2.554 | 1.775 |
| Customer Loyalty | -2.995 | 1.483 |
4.3. Data Quality Tests
Validity Test Result
Validity test aims to determine whether a measurement instrument accurately measures what it is intended to measure. Validity test utilizes factor analysis with a component matrix as a form of multivariate analysis. In the validity test, an item is considered valid if the factor loading value is >0.5. The results of the questionnaire validity test for each variable are as follows:
Table 3. Validity Test Result
| Variable | Loading Factor | Remark |
| Brand Awareness | 0.783 | Valid |
| 0.789 | Valid | |
| 0.584 | Valid | |
| 0.829 | Valid | |
| Brand Association | 0.536 | Valid |
| 0.811 | Valid | |
| 0.840 | Valid | |
| 0.800 | Valid | |
| Perceived Quality | 0.765 | Valid |
| 0.857 | Valid | |
| 0.852 | Valid | |
| 0.813 | Valid | |
| Brand Concept | 0.813 | Valid |
| 0.637 | Valid | |
| 0.802 | Valid | |
| 0.807 | Valid | |
| 0.824 | Valid | |
| 0.914 | Valid | |
| 0.945 | Valid | |
| Customer Loyalty | 0.709 | Valid |
| 0.781 | Valid | |
| 0.947 | Valid | |
| 0.924 | Valid |
Reliability Test Result
Reliability refers to the extent to which a research instrument can consistently yield relatively similar results in each measurement. Reliability test is conducted with the assistance of computer programs, namely data analysis software. The reliability test employs the Cronbach’s Alpha method. The criteria for Cronbach’s Alpha in reliability test are as follows: If the Cronbach’s Alpha value is >0.6 then a question is considered reliable. If the Cronbach’s Alpha value is <0.6 then a question is considered unreliable.
Table 4. Reliability Test Result
| Variable | Cronbach’s Alpha | Remark |
| Brand Awareness | 0.812 | Reliable |
| Brand Association | 0.753 | Reliable |
| Perceived Quality | 0.726 | Reliable |
| Brand Concept | 0.811 | Reliable |
| Customer Loyalty | 0.648 | Reliable |
Normality Test Result
The following table tests the normality of the influence of independent variables on the dependent variable. Data is considered normally distributed when it has a significance value, as the asymptotic significance (Asymp. Sig.), greater than 0.05. Table 5 concludes that the Asymptotic Significance value is >0.05, specifically 0.106. This indicates that the data is normally distributed in this study.
Table 5. Normality Test Result
| Unstandardized Residual | ||
| N | 232 | |
| Normal Parameters | Mean | 0 |
| Std Deviation | 108.610.891 | |
| Most Extreme Differences | Absolute | 0.08 |
| Positive | 0.052 | |
| Negative | -0.08 | |
| Kolmogorov-Smirnov Z | 1.211 | |
| Asymp.Sig.(2-tailed) | 0.106 | |
Multicollinearity Test Result
Multicollinearity indicates a correlation between independent variables that are not mutually independent. Multicollinearity can be assessed by examining the VIF (Variance Inflation Factor) values. Multicollinearity is considered present if there is a VIF value >10. Based on Table 6, it is observed that there are no VIF values exceeding 10, leading to the conclusion that there is no multicollinearity in this study.
Table 6. Multicollinearity Test Result
| Model | Unstandardized Coefficients | Standardized Coefficients | t | Sig. | Collinearity Statistics | ||
| B | Std. Error | Beta | Tolerance | VIF | |||
| (Constant) | -0.726 | 0.547 | -1.327 | 0.186 | |||
| Brand Awareness | 0.209 | 0.058 | 0.184 | 3.596 | 0.000 | 0.276 | 3.618 |
| Brand Association | 0.167 | 0.055 | 0.157 | 3.038 | 0.003 | 0.272 | 3.67 |
| Perceived Quality | 0.173 | 0.055 | 0.161 | 3.118 | 0.002 | 0.273 | 3.661 |
| Brand Concept | 0.286 | 0.019 | 0.543 | 15.171 | 0.000 | 0.566 | 1.768 |
Note: Dependent Variable: loyalty
Heteroscedasticity Test Result
Heteroscedasticity test within a regression model is useful for assessing whether there is variability inequality. If the residual variance is not constant, it is considered heteroscedasticity. The desired outcome in a study is the absence of heteroscedasticity. This study employs the Glejser test, which regresses the dependent variable with the absolute value of residuals (Abs_Res). Heteroscedasticity is deemed to occur if the significance value is found to be <0.05. Table 7 analyzes that the Sig. values do not have a value <0.05, leading to the conclusion that there is no heteroscedasticity in this study.
Tabel 7. Heteroscedasticity Test Result
| Model | Unstandardized Coefficients | Standardized Coefficients | t | Sig. | |
| B | Std. Error | Beta | |||
| (Constant) | 0.528 | 0.515 | 1.025 | 0.306 | |
| Brand Awareness | 0.051 | 0.049 | 0.132 | 1.057 | 0.292 |
| Brand Association | -0.057 | 0.045 | -0.157 | -1.274 | 0.204 |
| Perceived Quality | . 033 | 0.045 | 0.09 | 0.732 | 0.465 |
| Brand Concept | 0.006 | 0.013 | 0.034 | 0.486 | 0.627 |
Note: Dependent Variable: ABS_RES
Hypothesis Test Result
The research model is a multiple regression model or a test of multiple linear regression analysis with a numeric dependent variable (customer loyalty) and several independent variables (brand awareness, brand association, perceived quality, and brand concept) simultaneously.
F-Test Result
The F-test aims to prove whether independent variables collectively influence the dependent variable simultaneously. The hypothesis is accepted if the significance value is <0.05. Conversely, the hypothesis is rejected if the significance value is >0.05. Based on Table 8, an F value of 288.514 with a significance level of 0.000. Since the calculated F is greater than the tabulated F (288.514 > 2.411), and with a Sig value <0.05, it can be concluded that the independent variables influence on customer loyalty simultaneously.
Table 8. F-Test Result
| Model | Sum of Squares | df | Mean Square | F | Sig. |
| Regression | 1385.35 | 4 | 346.337 | 288.514 | .000a |
| Residual | 272.495 | 227 | 1.2 | ||
| Total | 1657.845 | 231 |
Note: Dependent Variable: Loyalty
t-Test Result
Using t-test, it can be determined partially how much influence each independent variable has on the dependent variable by looking at the 5% or 0.05 Sig value and comparing the calculated t-value with the tabulated t-value. The decision-making criteria in this study are: If Sig > 0.05 and the calculated t is less than the tabulated t then Ho is accepted. If Sig ≤ 0.05 and the calculated t is greater than the tabulated t then Ho is rejected.
Table 9. t-Test Result
| Model | Unstandardized Coefficients | Standardized Coefficients | t | Sig. | |
| B | Std. Error | Beta | |||
| (Constant) | -0.726 | 0.547 | -1.327 | 0.186 | |
| Brand Awareness | . 209 | 0.058 | 0.184 | 3.596 | 0.000 |
| Brand Association | 0.167 | 0.055 | 0.157 | 3.038 | 0.003 |
| Perceived Quality | . 173 | 0.055 | 0.161 | 3.118 | 0.002 |
| Brand Concept | 0.286 | 0.019 | 0.543 | 15.171 | 0.000 |
Note: Dependent Variable: loyalty
H1: Brand awareness has a significant positive influence on customer loyalty
Based on the above calculations, it is found that the calculated t-value is 3.596 with a tabulated t-value of 1.970 (calculated t > tabulated t), and a significance value of 0.000 (0.000 < 0.05). This means that H0 is rejected, and H1 is accepted. The conclusion is that brand awareness has a significant positive influence on customer loyalty. The findings of (Abbas et al., 2021) state that brand awareness influences customer loyalty. Other research results indicate that brand awareness directly influences customer loyalty (Mai et al., 2016). High brand awareness creates customer loyalty to a brand, thereby enhancing brand strength (Mlotkowska et al., 2022).
H2: Brand association has a significant positive influence on customer loyalty
Based on the above calculations, it is known that the calculated t-value is 3.038 with a tabulated t-value of 1.970 (calculated t > tabulated t), and a significance value of 0.003 (0.003 < 0.05). This means that H0 is rejected, and H2 is accepted. The conclusion is that brand association has a significant positive influence on customer loyalty. Positive and consistent association with a brand lead to a strong positive association with the service, thereby forming a greater sense of loyalty (Mlotkowska et al., 2022). Other study have demonstrated a solid correlation between brand association and customer loyalty. When brand association, including benefits, attributes, attitudes, and product quality, meet with customer needs, it leads to increased loyalty to the brand. (Phong et al., 2020).
H3: Perceived quality has a significant positive influence on customer loyalty
Based on the above calculations, it is known that the calculated t-value is 3.118 with a tabulated t-value of 1.970 (calculated t > tabulated t), and a significance value of 0.002 (0.002 < 0.05). This means that H0 is rejected, and H3 is accepted. The conclusion is that perceived study by (Segoro, 2013). Other research results show a strong relationship between perceived quality and customer loyalty (Ruiz et al., 2023). Additionally, in a study by (Lovemore et al., 2023), perceived quality significantly impacts on customer loyalty.
H4: Brand concept has a significant positive influence on customer loyalty
Based on the above calculations, it is known that the calculated t-value is 15.171 with a tabulated t-value of 1.970 (calculated t > tabulated t), and a significance value of 0.000 (0.000 < 0.05). This means that H0 is rejected, and H4 is accepted. The conclusion is that brand concept significantly influence on customer loyalty. The brand concept is positively related to sensory experiences and emotional attachments. This can express a significant part of one’s self-concept. Customers satisfied with the brand concept are more likely to connect with the brand (Jeon, 2017).
Coefficient of Determination Test Result
The Coefficient of Determination (R Square) can measure the percentage of the independent variable’s influence on the dependent variable in the regression model. The coefficient of determination (R Square) in the study is 0.836 or 83.6%. This means that brand awareness, brand association, perceived quality, and brand concept collectively influence customer loyalty 83.6%. The remaining 16.4% is influenced by other variables outside of this regression equation or variables not examined.
Table 10. Coefficient of Determination Test Result
| Model | R | R Square | Adjusted R Square | Std. Error of the Estimate |
| 1 | .914a | 0.836 | . 833 | 1.096 |
Note: Dependent Variable: loyalty
5. Conclusion
This study concludes that all the examined dimensions of brand equity, namely brand awareness, brand association, and perceived quality, influence customer loyalty. Similarly, the brand concept variable also has a significant positive influence on customer loyalty. Clinics are obligated to maintain brand equity and brand concept as intangible resources. Thus, clinic management should consider not only the health aspect and technological advancements but also meet customer needs, thereby creating satisfaction and loyalty that ultimately enhances clinic revenue.
5.1. Managerial Implications
Batam City with its various industries and a significant workforce, requires occupational health examination at least once a year. Based on this need, efforts to build a positive clinic image strongly support the sustainability of the health industry business. When in need of health examinations, workforce spontaneity leads them to think of a particular brand, a brand with a specific main business, considering the location quickly, recognizing the building’s structure, experiencing good service quality, knowing the shape and color of the logo, and committing to reuse the services.
5.2. Study Limitations and Future Directions of Research
This study only involved three health examination clinics in Batam City and did not examine what strategies have been implemented to enhance customer loyalty. It is hoped that future researchers can analyze a larger number of locations and research respondents, and not be limited to specific regions. Additionally, they can analyze the marketing strategies that have been implemented.
The clinic is expected to continue enhancing its close relationship with its customers. Efforts to further introduce the brand and improve the service quality advantage are also highly beneficial in meeting customer expectations. Additionally, for the clinic, retaining existing customers is certainly much more cost-effective than attracting new ones. Future researchers are expected to research with hospitality objects (Purwianti, 2023) and to add trust variables in the proposed model, because trust is very important in building consumer participation, one of which is purchase intention (Purwianti, 2019).
---
Author Contributions: Lily Purwianti: Conceptualization, Methodology, Writing- Reviewing and Editing, Validation. Dewi Kurniawaty: Data curation, Writing- Original draft preparation. Pulung Peranginangin: Supervision.
Funding: This research received no external funding
Conflicts of Interest: The authors state that they have no conflicts of interest.
---
Disclaimer/Publisher’s Note: The views, statements, opinions, data and information presented in all publications belong exclusively to the respective Author/s and Contributor/s, and not to Sprint Investify, the journal, and/or the editorial team. Hence, the publisher and editors disclaim responsibility for any harm and/or injury to individuals or property arising from the ideas, methodologies, propositions, instructions, or products mentioned in this content.
References
- Abbas, U., Islam, K. M. A., Hussain, S., Baqir, M., and Muhammad, N., 2021. Impact of Brand Image on Customer Loyalty With the Mediating Role of Customer Satisfaction and Brand Awareness. International Journal of Marketing Research Innovation, 5(1), pp.1–15. https://doi.org/10.46281/ijmri.v5i1.987
- Aladwan, M. A., Salleh, H. S., Anuar, M. M., and Almomani, I., 2021. The Relationship among Service Quality , Patient Satisfaction and Patient Loyalty : Case Study in Jordan Mafraq Hospital. 5(June), pp.27–40.
- Annur, C. M., 2022. Berapa Jumlah Sarana Kesehatan di Indonesia? Databoks.Katadata.Co.Id, 2021, 1–6. https://databoks.katadata.co.id/datapublish/2022/03/07/berapa-jumlah-sarana-kesehatan-di-indonesia
- Apuke, O. D., 2017. Quantitative Research Methods : A Synopsis Approach. Kuwait Chapter of Arabian Journal of Business and Management Review, 6(11), 40–47. https://doi.org/10.12816/0040336
- Armadani, F. N., Supriyadi, S., and Ulfah, N. H., 2018. Hubungan Brand Equity (Brand Awarenees, Brand Associations, Perceived Quality) dengan Keputusan Pemanfaatan Klinik Laktasi di Rumah Sakit Muhammadiyah Lamongan. Preventia : The Indonesian Journal of Public Health, 3(1), pp.49. https://doi.org/10.17977/um044v3i1p49-65
- Ashraf, S., Ilyas, R., Imtiaz, M., and Ahmad, S., 2018. Impact of Service Quality, Corporate Image and Perceived Value on Brand Loyalty with Presence and Absence of Customer Satisfaction: A Study of four Service Sectors of Pakistan. International Journal of Academic Research in Business and Social Sciences, 8(2). https://doi.org/10.6007/ijarbss/v8-i2/3885
- Benny, F., Rutinaias, S, P., Krisno, D., Samuel, H., Si, M., Ardi, P. N., Indriati, A., Wiwaha, S. W., and Fitriana, N., 2020. Pengaruh perceived quality, perceived sacrifice dan perceived value terhadap customer satisfaction di informa innovative furnishing Pakuwon city Surabaya. Jurnal Teknologi Dan Terapan Bisnis, 1(1), pp.30–39. https://jurnal.aksi.ac.id/index.php/jttb/article/view/80
- Chang, C. . W., Tseng, T. ., and Woodside A. G., 2013. A Conceptual Framework of Antecedents of Service Loyalty in Health Care : Patients ‘ Perspective. https://doi.org/10.1177/2277975218812952
- Eldegwy, A., Elsharnouby, T. H., and Kortam, W., 2018. How sociable is your university brand? An empirical investigation of university social augmenters’ brand equity. International Journal of Educational Management, 32(5), pp.912–930. https://doi.org/10.1108/IJEM-12-2017-0346
- Etikan, I., 2017. Sampling and Sampling Methods. Biometrics and Biostatistics International Journal, 5(6), pp.215–217. https://doi.org/10.15406/bbij.2017.05.00149
- Gálvez-Ruiz, P., Calabuig, F., Grimaldi-Puyana, M., González-Serrano, M. H., and García-Fernández, J., 2023. The effect of perceived quality and customer engagement on the loyalty of users of Spanish fitness centres. Academia Revista Latinoamericana de Administracion, 36(4), pp.445–462. https://doi.org/10.1108/ARLA-01-2023-0014
- Ghaleb Magatef Elham Fakhri Tomalieh, S., 2015. The Impact of Customer Loyalty Programs on Customer Retention. International Journal of Business and Social Science, 6(81), pp.78–93.
- Górska-Warsewicz, H., 2022. Consumer or Patient Determinants of Hospital Brand Equity—A Systematic Literature Review. International Journal of Environmental Research and Public Health, 19(15). https://doi.org/10.3390/ijerph19159026
- Gul, R., 2014. The Relationship between Reputation, Customer Satisfaction, Trust, and Loyalty. Journal of Public Administration and Governance, 4(3), p.368. https://doi.org/10.5296/jpag.v4i3.6678
- Hair, J., Hollingsworth, C. L., Randolph, A. B., Yee, A., Chong, L., Hair, J., Hollingsworth, C. L., Randolph, A. B., Yee, A., Chong, L., Hair, J., Yee, A., and Chong, L., 2017. An updated and expanded assessment of PLS-SEM in information systems research. https://doi.org/10.1108/IMDS-04-2016-0130
- Huei, C. T., Mee, L. Y., and Chiek, A. N., 2014. A Study of Brand Image, Perceived Service Quality, Patient Satisfaction and Behavioral Intention among the Medical Tourists. GATR Global Journal of Business Social Sciences Review, 2(2), pp.32–43. https://doi.org/10.35609/gjbssr.2014.2.2(4)
- Irma Asriani, Usman, and Makhrajani Majid., 2019. Pengaruh Ekuitas Merek Terhadap Keputusan Pemanfaatan Pelayanan Rawat Jalan Rumah Sakit Ibu Dan Anak Ananda Trifa Kota Parepare. Jurnal Ilmiah Manusia Dan Kesehatan, 2(3), pp.354–366. https://doi.org/10.31850/makes.v2i3.178
- Jeon, J.-E., 2017. The impact of brand concept on brand equity. Asia Pacific Journal of Innovation and Entrepreneurship, 11(2), pp.233–245. https://doi.org/10.1108/apjie-08-2017-030
- Kanagal, N. B., 2015. Innovation and product innovation in marketing strategy. Journal of Management and Marketing Research, 18, pp.1–25. http://www.aabri.com/copyright.html
- Karim, K., and Tajibu, M. J., 2022. Penentu Loyalitas Konsumen Pada Bank Konvensional Berdasarkan Faktor Pribadi Dan Psikologis. BISMA: Jurnal Bisnis Dan Manajemen, 16(2), p.122. https://doi.org/10.19184/bisma.v16i2.30846
- Khuong, M. N., Hoa, N. V. A., and Nguyen, T. D., 2016. The Effect of Television Commercials on Customers’ Loyalty — A Mediation Analysis of Brand Awareness. International Journal of Trade, Economics and Finance, 7(2), pp.18–24. https://doi.org/10.18178/ijtef.2016.7.2.493
- Purwianti, L. (2019). Peran Mediasi Perceived Usefulness Dalam Platform C2C E-Commerce. Jurnal Manajemen Dan Pemasaran Jasa, 12(2), 237–252. https://doi.org/10.25105/jmpj.v12i2.3718
- Purwianti, L., 2023. Peranan Mediasi Inovasi Dan Absorptive Capacity Dalam Meningkatkan Kinerja Hotel Selama Pandemi COVID 19. EKUITAS (Jurnal Ekonomi Dan Keuangan), 7(2), pp.171–192. https://doi.org/10.24034/j25485024.y2023.v7.i2.5251
- Loeb, S., Dynarski, S., McFarland, D., Morris, P., Reardon, S., and Reber, S., 2017. Descriptive analysis in education: A guide for researchers. U.S. Department of Education, Institute of Education Sciences. National Center for Education Evaluation and Regional Assistance, March, 1–40. https://eric.ed.gov/?id=ED573325
- Lovemore, C., Chavunduka, D., Chinofunga, S., Marere, R. P., Chifamba, O., and Kaviya, M., 2023. Promoting perceived service quality and organisational performance through customer retention strategies: the moderating role of ICT. European Journal of Management Studies, 28(3), pp.193–211. https://doi.org/10.1108/ejms-01-2023-0003
- Loureiro, S. M. C., 2013. The effect of perceived benefits, trust, quality, brand awareness/associations and brand loyalty on internet banking brand equity. International Journal of Electronic Commerce Studies, 4(2), pp.139–158. https://doi.org/10.7903/ijecs.1000
- Młotkowska, K., and Kowalik, I., 2023. Mazovia brand awareness among corporate customers: implications for local authorities. Central European Management Journal, 31(1), pp.130–145. https://doi.org/10.1108/CEMJ-10-2021-0114
- Mukaram, A., Sangen, M., and Rifani, A., 2018. The Effect of Brand Equity on Purchase Decisions at Banjarmasin Islamic Hospital , Indonesia Services. European Journal of Economic and Financial Research, 3(2), pp.101–116. https://oapub.org/soc/index.php/EJEFR/article/view/496
- Nugroho, I. ., and Rochmah, T. N., 2013. Analisis Pengaruh Brand Equity Terhadap Keputusan Masyarakat Dalam Memilih Rumah Sakit Muhammadiyah Surabaya.
- Permenaker., 1980. Permenaker 02/1980 Pemeriksaan kesehatan tenaga kerja dalam penyelenggaraan keselamatan kerja. 02, pp.1–6.
- Pilehvarian, N. K., Üniversitesi, Y. T., and Fakültesi, M., 2015. Planlama, Mimarlik, Tasarim Ve Yapim Yildiz Teknik Üniversitesi Mimarlik Fakültesi E-Dergisi Planning, Architecture, Design And Construction The E-Journal Of Ytu Faculty Of Architecture Genel Yayin Yönetmeni (Managing Director) Editör (Editor) Asuman Türk. www.megaronjournal.com.
- Phong, L. T., Nga, T. H., Hanh, N. T., and van Minh, N., 2020. Relationship between brand association and customer loyalty: The case of online retail industry. Management Science Letters, 10(7), pp.1543–1552. https://doi.org/10.5267/j.msl.2019.12.012
- Radansyah, S., Indriasari, N., and Wagini, W., 2021. Hubungan Ekuitas Merek (Brand Equity) Dengan Loyalitas Pelanggan Pada Pt. Enseval Putera Megatrading Tbk Cabang Bengkulu. EKOMBIS REVIEW: Jurnal Ilmiah Ekonomi Dan Bisnis, 9(1), pp.39–49. https://doi.org/10.37676/ekombis.v9i1.1223
- Razak, N., Themba, O. S., and Herman Sjahruddin., 2019. Brand awareness as predictors of repurchase intention: Brand attitude as a moderator. Advances in Social Sciences Research Journal, 6(2), pp.541–554. https://doi.org/10.14738/assrj.62.6264
- Roy, D. G., Battacharya, S., and Mukherjee, S., 2018. Qualitative explorations into customer based brand equity (CBBE) for medical tourism in India. Qualitative Report, 23(10), pp.2422–2452. https://doi.org/10.46743/2160-3715/2018.3137
- Segoro, W., 2013. The Influence of Perceived Service Quality, Mooring Factor, and Relationship Quality on Customer Satisfaction and Loyalty. Procedia - Social and Behavioral Sciences, 81, pp.306–310. https://doi.org/10.1016/j.sbspro.2013.06.433
- Shamsudin, M. F., and Razali, N. A. M., 2015. Factors Influencing Customer Loyalty In Private Healthcare Services. The International Journal of Social Sciences and Humanities Invention, October. https://doi.org/10.18535/ijsshi/v2i10.03
- Sumarni., 2018. Pengaruh Brand Equity Terhadap Minat Pemanfaatan Kembali Pelayanan Pada Instalasi Rawat Inap Rumah Sakit Ibnu Sina Makassar. Indonesian Journal of Hospital Administration, 1(1), pp.1–10. https://doi.org/10.21927/ijhaa.v1i1.753
- Syukri, A., 2018. Analisis Pengaruh Ekuitas Merek dan Kualitas Pelayanan Terhadap Loyalitas Pelanggan (Studi Kasus Rumah Sakit Syarif Hidayatullah. Jurnal Semarak, 1(2), pp.1–20. http://openjournal.unpam.ac.id/index.php/smk/article/view/1799
- Severi, E., and Ling, K. C., 2013. The mediating effects of brand association, brand loyalty, brand image and perceived quality on brand equity. Asian Social Science, 9(3), pp.125–137. https://doi.org/10.5539/ass.v9n3p125
- Wei, L. H., Huat, O. C., and Thurasamy, R., 2023. The impact of social media communication on consumer-based brand equity and purchasing intent in a pandemic. International Marketing Review. https://doi.org/10.1108/IMR-12-2021-0353
- Wu, M.-Y., and Tseng, L.-H., 2014. Customer Satisfaction and Loyalty in an Online Shop: An Experiential Marketing Perspective. International Journal of Business and Management, 10(1), pp.104–114. https://doi.org/10.5539/ijbm.v10n1p104
- Wijaksono, D., and Ali, H., 2019. Model repurchase intentions: analysis of brand awareness, perceived quality, brand association, and brand loyalty (case study private label on store Alfamidi In Tangerang). Saudi Journal of Humanities and Social Sciences, 4(5), pp.371–380. https://doi.org/10.21276/sjhss.2019.4.5.10
- Zhou, W. J., Wan, Q. Q., Liu, C. Y., Feng, X. L., and Shang, S. M., 2017. Determinants of patient loyalty to healthcare providers: An integrative review. International Journal for Quality in Health Care, 29(4), pp.442–449. https://doi.org/10.1093/intqhc/mzx058
Article Rights and License
© 2024 The Authors. Published by Sprint Investify. ISSN 2359-7712. This article is licensed under a Creative Commons Attribution 4.0 International License.