Keywordscustomer satisfaction Entertainment Industry Experiential Marketing Experiential Value
JEL Classification M30
Acknowledgements:
This research project was supported by a grant from the Research Center for the Humanities, Deanship of Scientific Research, King Saud University.
Full Article
1. Introduction
Because marketing discipline is evolving continuously, researchers and practitioners are in a permanent adaptation process of their focus, thought and practice. At each step of the marketing evolution new tools and strategies are implemented to gain insights and reach theoretical and managerial objectives (Maklan and Klaus, 2011; Kumar, 2015; Batat, 2019).While trying to adapt to changing marketing, companies face pressures for instance in driving brand awareness, in building an outstanding customer experience, enhancing customer loyalty, and increasing profits (Ismail, 2011; Cachero-Martínez and Vázquez-Casielles, 2017). Nowadays, organizations encourage consumers to take part in the production process. Customers become co-producers of the service and they shape the value of the final outputs (Batat, 2019). Therefore, the service can be seen as form of value rather than activity (Edvardsson, 2005). The value does not exist only in the firm's products or during the exchange prossess, it arises through the experience when the customer uses the provider's offers and facilities (Heinonen et al., 2013).
Organizations ought to interact with customers in the process of value creation. Service providers should assist their consumers in their daily activities and providing them with the necessary information. Service concept evolved, thus firms and customers’ role in value creation changed. The customers are value creators and the service providers as co-creators support them in the value creation (Grönroos (2008; 2011); Heinonen et al., (2010; 2013)). The customers create value into two phases: the value-generating processes or the consumption and the value-supporting interactions (Heinonen et al., 2010; Voima et al., 2011, Grönroos and Ravald 2011). The value occurs therefore during and after customers' experiences: through the service encounter and from the consumption of the service intrinsic aspects. Customers experience the value; they create it by use and interaction. The value comes from benefits and sacrifices elements and it has a multidimensional conceptualization. The value creation starts firstly in the process and outcome, then it is reinforced during the experience consumption's time and location (Heinonen, 2004; Heinonen and Strandvik, 2009). Understanding consumer experiences is therefore a core task for both researchers and practitioners. On other word, delivering unique and memorable experience is the key success for business. Experiential marketing represents new tactics and techniques that should be used especially in service industry with emphasis on high quality service standards to reach customer satisfaction (Yuan and Wu, 2008; Yeh et al., 2019; Shah et al., 2019; Batat, 2019).
The experiential marketing emphasis on customer experience and considers the consumption as holistic experience (Amoroso, 2019; Schmitt, 1999). The concept of experiential marketing has been studied in the areas of marketing such as services, retail and branding (Yuan and Wu, 2008; Skandalis, 2019;Ihtiyar et al., 2019). However, the literature review showed a lack of researches on the effectiveness of experiential marketing in the field of entertainment. The present study aims to explore the customer experience in entertainment context and to examine the relationship between customer experience and customer satisfaction trough the experiential value. The research question is subdivided into two interrogations. First, does customer experience create experiential value? Second, does experiential value enhance customer satisfaction?
2. Literature Review
2.1 Experiential Value
Experiential value represents the customer perceptions of products or services, either through direct use or indirect observation (Mathwick et al., 2001). Experiential value arises from different forms of experiences. Value is perceived subjectively and it is created based on the exchange of experiences incurred in the process of transaction or through individual perceptions (Lee and Overby, 2004). Value occurs during and after the consumption experience, it includes utilitarian aspect or functional value as well as a hedonic value (Lee and Overby, 2004; Addis and Holbrook, 2001; Berry et al., 2002).The functional value represent the basic value captured by customers, while the emotional value represents the feeling or emotional reaction that visitors gain during and after experiencing (Berry et al., 2002; Schmitt, 1999).
Experiential value happens during consumption through contact fantasies, feeling as well fun and influences the customer decision making process (Gentile et al., 2007; Holbrook, 2000). The experiential value perceived by consumers can be determined through an evaluation of a number of elements such as aesthetic, playfulness, service excellence, consumer return on investment, and service efficiency (Chou, 2009; Wu and Liang, 2009).The literature review presents experiential value as a multidimensional concept that integrates four dimensions, namely utilitarian, emotional, social, and altruistic (Wu and Liang , 2009; Holbrook, 2000; Boztepe, 2010). Additionally, researches showed that the two concepts experiential marketing and experiential value are positively related (Wang and Lin, 2010).
The current study's interest is on the entertainment experience lived on the Riyadh Winter Wonderland located in Saudi Arabia, therefore the emotional aspect of the experiential value is considered as the most adequate aspect that capture the experiential marketing effort. The emotional side of the experiential value focuses on how enthusiastic the service provider is about immersing visitors in experiencing all entertainments services offered? Does the service provider create the delightful world that submerge individual in magical experience?
2.2 Antecedents of Experiential Value
Marketing function is vital to develop competitive strategies for businesses. In implementing strategies, companies should create a unique and exceptional value for their customers to reach competitive advantages (Kalantari and Johnson, 2018).Experiential Marketing can be considered to be a new phenomenon in marketing and it can be implemented in different industries. Actually, organizations have moved from the traditional marketing, which emphasizes on features and benefits as well, to experiential marketing which focuses on creating unique and memorable customer experience (Schmitt, 1999; Batat, 2019).
Experiential marketing is defined as "the customers’ recognition of and purchasing of goods or services from a company or brand after they experience activities and perceive stimulations". It represents a "memorable memory or experience that goes deeply into the customer’s mind" (Schmitt, 1999; Lee et al., 2011). Experiences lived improve the value of a product, a brand, or a company. In practice, experiential marketing enhance customers’ feelings and sense stimulation without neglecting the offers quality (Schmitt, 1999). Experiential marketing is based on two key strategic concepts: Strategic Experiential Modules (SEMs) and Experience Providers (ExPros). ExPros play a fundamental role on experiential marketing. They incorporate “communications, visual/verbal aspects as well as signage, products presence, co-branding, the spatial and electronic environment, and people” (Schmitt, 1999). ExPros convey the SEMs combination to consumers and create the experiential consumption. As the implementation tools of experiential marketing, ExPros should be coherent, consistent over time and efficiently used to maximize experience level (Schmitt, 1999). SEMs represent the strategic experiential modules that marketers manipulate to generate varieties of customer experiences. Based on modern researches in cognitive science and the philosophy of mind, the experiential modules extracted are used in experiential marketing. According to Schmitt (1999) SEMs integrate five types of experiences named: “sensory (SENSE), affective (FEEL), creative cognitive (THINK), physical including behaviors and lifestyles (ACT), and social-identity derived from belonging to a reference group or a specific culture (RELATE)” (Schmitt, 1999).These five sensory experiences “appeal to the senses with the objective of creating sensory, experiences through sight, sound, touch, taste and smell” (Schmitt, 1999; Maghnati et al., 2012; Brakus et al., 2009). Every SEM possesses its own structure and principles through which it allows achieving specific objectives. Generally, in order to reinforce the experiential appeal brands can decide to engage in two or more SEMs. However, Schmitt (1999) recommend to marketers to use the whole five SEMs in develop customer experiences. Following, impacts of the experiential marketing dimensions on experiential value (emotional value) are discussed.
Feel reflects inner feelings and emotions of customers resulting from the consuming of products and services (Yang and He, 2011; Yuan and Wu, 2008). The positive feel generated during the consumption process creates a positive emotion (Schmitt, 1999).Feel experiences focus on stimulate emotionally customers to engage them on an empathic perspective (Schmitt,1999; Yang and He, 2011; Yuan and Wu, 2008).The emersion in an experience permits that the consumers feel the brand (Williams, 2006). The positive and strong emotions, emerged from that experience, enhance the overall customer and seller relationship management (Maghnati, et al., 2012; Mattila, 2001).
H1: Feel experience has a positive impact on experiential emotional value.
The simulation of the five human senses (sight, taste, scent, touch and hearing) creates an experiential response called sense experience. Sensory experiences add value to products and services as well as seduce customers by a sensory excitement (Schmitt, 1999; McCole, 2004; Yuan and Wu, 2008). Through sensory experience, a form of experience logic or cognitive consistency is developed and consumers use it to constitute subjective value judgments that add value and differentiate the products and services being experienced by them (Vargo and Lusch, 2004; Shmitt, 1999).
H2: Sense experience has a positive impact on experiential emotional value.
Think experience is related to amazement, conspiracy, exhortation and excitement; it lies on the consumer’s intelligence to generate cognitive experience (Lee et al., 2008). Think experience goal is to induce customers on a creative thinking by a simulation of new idea or thinking about a company or its products. For instance, think appeals stimulate and engage customers cognitively through surprise, intrigue and provocation (Schmitt, 1999).
H3: Think experience has a positive impact on experiential value.
Act experience "focuses on the physical experience of consumers and aims to provide enriched alternative lifestyles, role models or emotional, inspirational and motivational experiences to customers" (Soares and Elmashhara, 2020). Consumers live experiences related to their physical body, behavior and lifestyle through social interactions. Action experiences propose alternate ways of doing things, alternate lifestyles as well as connections with others. These experiences stimulate sensations, emotions and reinforce motivations that shape customer’s relationships with products or services offered (Schmitt, 1999).
H4: Act experience has a positive impact on experiential emotional value.
Relate or Social-identity experience incorporates elements of sense, feel, think and act marketing. Relate marketing goes beyond the individual's personal private feelings, it relates to something outside of the individuals private situation (e.g. family members or friends) thus creating a sense of self-improvement (Schmitt, 1999). Relate marketing orients the consumers’ mind and feelings far from the relate experience and linked them to the products or services social context. It creates a powerful and contextual contacts and experience of customer’s individual action, thought and feelings (Yu and Ko, 2012). Relate experience permits to consumers to construct bonds with the social communities and social entities through purchasing and consuming (Chang et al., 2011). Marketers can create positive relate experience using relate marketing campaign that enhance self-improvement by a social community’s integration (Schmitt, 1999).
H5: Relate experience has a positive impact on experiential emotional value.
2.3 Impact of experiential value on Customer satisfaction
Satisfaction is an important variable in experiences (Oliver, 1980; Westbrook and Oliver, 1991).
A customer satisfaction occurred after a transaction results from an immediate positive assessment after the purchase or a positive feeling towards the transaction experience (Oliver, 1993). There are two type of evaluation. The first one relies on transaction-specific aspect which is defined on the basis of the customers' evaluation of the value they obtain after completing one specific transaction (Engel et al., 1995; Oliver, 1993). The second one relies on customer evaluation of purchasing and consumption experiences with regard to companies ’performance, whether in the past, present or future (Patterson and Spreng, 1997).Customer satisfaction level is expressed also by feeling emerged during transaction experiences. Satisfaction represents the outcome of product’s expectation and function; it reflects the amount of happiness or disappointment (Li and Lee,2016;Warde, 2017).It is known that customers have expectations regarding their future purchase and experience, so the level of customer satisfaction will be affected by the level of performance during and after the experience process (Yuan and Wu, 2008,Warde, 2017). Moreover, it is found that physical environment with its elements affects the response of customers and their experience; these elements consist of music, color, smell, and crowding level (Areni and Kim, 1993; Bellizzi, et al., 1983; Spangenberg et al., 1996; Hui and Bateson, 1991; Cuong, 2020).
Satisfaction in this study reflects the overall consumer’s assessment of the service provided during and after the period of its consumption. According to Schmitt (1999), emotional and functional value delivered through experiential marketing can lead to customer satisfaction. Customers compare their experiences with their prior expectations, which cause positive or negative disconfirmation (Kao et al., 2008). The emotional responses resulting from positive or negative disconfirmation form the basis for customer satisfaction or dissatisfaction (Bigne et al., 2005). Previous studies confirmed the positive relationship between experiential values and customer satisfaction (e.g., Cronin et al., 2000; Ennew and Binks, 1999; Fornell et al., 1996; Kristensen et al., 2000; Patterson and Spreng, 1997). Customers are satisfied when the perceived service value is beyond their expectations, while they are not satisfied when the perceived value is less than expected (Yuan and Wu, 2008; Prakash, 2019; Wu et al., 2018).
H6: Experiential emotional value has a positive impact on customer satisfaction
Given the afore mentioned hypotheses, a conceptual framework was developed (Fig.1).
3. Methodology
3.1. Sampling and Data Collection
To examine the relationships among customer experience, experiential value, and customer satisfaction, an online survey through Google Forms was conducted to collect data. The questionnaire included a filter question to select only respondents visited Riyadh Winter Wonderland, four demographic questions, and three seven-point Likert scales to measure the research concepts. A convenience sampling was conducted in this study. The size of the survey sample included 154 respondents. Most respondents (66.9%) were between 18 and 25 years old and more than half of the sample's members were women (72.6%). 45.5% of research participants declared visit the entertainment place 1 time, 24.7 % two times and 29.9 % three times. Furthermore, 78.6 % of the sample has university level and 50 % gain less than 5000 Saudi Riyals per month.
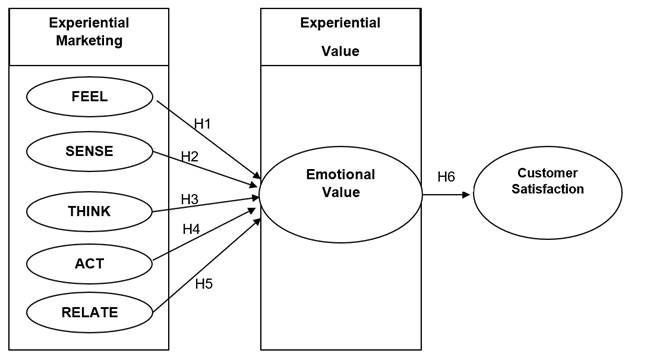
Figure1. Conceptual Framework
3.2. Measures
Scales were selected from the literature (Table1). Given that Arabic is the first language of the population, most of the academic studies is conducted in Arabic. Therefore, the scales were translated from English to Arabic using the back-translation technique. The experiential marketing scale was adapted from Schmitt’s (1999) study and those measuring the experiential value and customer satisfaction from Wu and Li (2018).
Table1. Research Scales
| Construct | Label | Item Wording |
| SENSE | SE1 | The entertainment place tries to engage my senses. |
| SE2 | The entertainment place is perceptually interesting. | |
| SE3 | The entertainment place lacks sensory appeal for me. | |
| FEEL | FE1 | The entertainment place tries to put me in a certain mood. |
| FE2 | The entertainment place makes me respond in an emotional. | |
| FE3 | The entertainment place does not try to appeal to feelings. | |
| FE4 | I felt bored in The entertainment place. | |
| THINK | TE1 | The entertainment place tries to intrigue me. |
| TE2 | The entertainment place stimulates my curiosity. | |
| TE3 | The entertainment place tries to appeal to my creative thinking. | |
| ACT | AE1 | I would like to share what I experienced in the entertainment place |
| AE2 | I would like to take pictures in the entertainment place as mementos. | |
| RELATE | RE1 | I would buy some souvenirs which are related to the entertainment place |
| RE2 | The entertainment place induces me a sense of identity towards ecological conservation | |
| RE3 | I can enhance my relationship with people I like by visiting Winter Wonderland. | |
| RE4 | Winter Wonderland makes me think about social activities. | |
| Experiential Value (Emotional Value) | EV1 | Visiting this entertainment place is pleasurable. |
| EV2 | Visiting this entertainment place makes me feel better. | |
| EV3 | This entertainment place is a wonderful tourist attraction that I enjoy. | |
| Customer Satisfaction | CS1 | This entertainment place goes beyond my expectations. |
| CS2 | I really like this trip to this entertainment place. | |
| CS3 | It is worthwhile to be in here. |
3.3. Data Analysis
The reliability and the validity of the measures were verified in two steps: A descriptive analysis with SPSS and a first order confirmatory analysis using Amos (Roussel et al., 2002). The evaluation of the relationships and the parameters within the theoretical framework, as well as the model fit with the numerical data, were performed by the use of Amos.
4. Result Analysis
4.1. Scales' dimensionality and reliability
The Principal component analysis (PCA) showed the existence of seven factors conserved by the confirmatory factor analysis (Table2). The reliability was measured using the Cronbach’s alpha coefficient which indicates the level of internal items consistency. Results showed that Cronbach’s alpha coefficient was ranged from 0,706 to 0,849 (Table2); thus, the scales used for this study were considered to be reliable (Hair, et al., 2006; DeVellis, 2012).The extraction of each kept item is higher than 0.5 (Evrard et al., 2003).
4.2. Confirmatory factor analysis
Reliability was verified by Jöreskog'sRhô, its accepted value is 0.7 or above for a construct (FornellandLarcker 1981; Didellon and Valette-Florence, 1996). All of the rho values range from 0.708 to 0.867 (Table2). The weights of all the items are higher than 0.5 and the Critical Ratio (CR), associated to each factorial contribution, is above 1.96 as recommended by (Lavoisier, 2000). Convergent validity was assessed by calculating the Rhô of convergent validity (ρvc) which accepted value is 0.50 or above for a construct (Fornell and Larcker, 1981). All of ρvc values range from 0.548 to 0.689 (Table 2).
Table 2 Principal Component Analysis, Reliability and Convergent Validity
| Factor's name | Items | Factor Loading | Communality | Cronbach's Alpha | Joreskog rho | Rhô of Convergent Validity |
| Sense | SE1 | 0.855 | 0.732 | 0.800 | 0.811 | 0.593 |
| SE2 | 0.891 | 0.793 | ||||
| SE3 | 0.796 | 0.634 | ||||
| Feel | FE1 | 0.875 | 0.734 | 0.798 | 0.803 | 0.579 |
| FE2 | 0.877 | 0.768 | ||||
| FE3 | 0.799 | 0.638 | ||||
| Think | TE2 | 0.794 | 0.891 | 0.739 | 0.743 | 0.592 |
| TE3 | 0.794 | 0.891 | ||||
| Act | AE1 | 0.879 | 0.773 | 0.706 | 0.708 | 0.548 |
| AE2 | 0.879 | 0.773 | ||||
| Relate | RE3 | 0.917 | 0.841 | 0.809 | 0.812 | 0.684 |
| RE4 | 0.917 | 0.841 | ||||
| Experiential Value | EV1 | 0.925 | 0.855 | 0.828 | 0.867 | 0.689 |
| EV2 | 0.801 | 0.641 | ||||
| EV3 | 0.893 | 0.797 | ||||
| Customer Satisfaction | CS1 | 0.856 | 0.732 | 0.849 | 0.859 | 0.672 |
| CS2 | 0.884 | 0.782 | ||||
| CS3 | 0.906 | 0.822 |
4.3. Global significance and model fit
Analysis confirmed that there were no negative variance values and that all the standardized coefficients were above 1. The fit indices showed that the model fits the empirical data. As shown in Table3, the overall fit of the measurement models was adequate: X2/df = 1.325< 2 (Pedhazurand Pedhazur-Schmelkin, in Roussel et al., 2002). The RMSEA = 0.046was less than 0.08, indicating adequate fit (Browne and Cudeck, 1993). The GFI = 0.90 is above 0.8, it represents an acceptable fit (Baumgartner and Homburg, 1995; Doll et al., 1994). Furthermore, the CFI = 0.980 is above the threshold of 0.9 (Bentler, 1990) and the NFI= 0.924 is above 0.8 (James et al., 1982). The standardized root mean residual (SRMR) value (0.039) was equivalent to or less than the recommended threshold of .08 (Hu and Bentler, 1999; MacCallum et al., 1996).However, the model showed the existence of a set of not significant effects as the value of Critical Ratio was lower than 1.96.
4.4. Hypothesis Testing
To test the research model hypotheses, a structural equations modeling technique was used . Results are summarized in Table3. Result demonstrated that only the relations between sense experience, experiential value and customer satisfaction are significant. Thus, all the hypotheses H1, H3, H4, and H5 are unconfirmed. Sense experiences had a positive impact on experiential value (β = 0.964; t = 3.695> 1.96), accordingly H2 is supported. Experiential value had a positive effect on customer satisfaction (β = 0.979; t = 10.438> 1.96), consequently H6 is supported.
Table 3. Hypotheses Test Results
| Hypotheses | Hypothesis Path | Standardized Estimate | CR | P (***p<0.001) |
| H1 | EV <---- FE | -0.104 | -0.435 | 0.664 |
| H2 | EV <---- SE | 0.964 | 3.695 | *** |
| H3 | EV <---- TE | 0.413 | 1.345 | 0.179 |
| H4 | EV <---- AE | -0.196 | -0.369 | 0.712 |
| H5 | EV <---- RE | -0.057 | -0.520 | 0.603 |
| H6 | CS <---- EV | 0.979 | 10.438 | *** |
5. Discussion and Implications
This research contributes to a better understanding of ‘feel’, ‘sense’, ‘think’, ‘act’ and ‘think’ experiences effects on experiential value and customer satisfaction. Similarity and differences with previous researches as well suggestions on the use of experiential marketing are discussed below.
As previous studies, findings supported that experiential marketing contributes to customer satisfaction through the creation of a positive experiential value (Yuan and Wu, 2008; Schmitt, 1999). However, the positive impact between experiential marketing and experiential value is maintained only via the sense experience. These findings converge with those of Kanopaite (2015), this author found that in restaurant experience only sense and feel experiences from experiential marketing were proved to have a statistically significant impact on the emotion value.
Similar to previous studies (e.g. Nadiri and Gunay, 2013; Kanopaite, 2015; Ihtiyar and Aras, 2020), the relationship between sense and emotional value is supported, although this finding is in contradiction with Yuan and Wu (2008).This result demonstrates that Saudis consider senses, which refers to aesthetics and sensory qualities, as more important in term of value creation than fell, act, think and relate aspects. Considering that 45.5% of study participants declared visiting Riyadh Winter Wonderland once, it is possible that they enjoy their initial experience perceptually through senses, however more familiarity with the entertainment place will push consumers to pay attention to other features influencing ‘feel’, ‘act’, ‘think’, and ‘relate’ experiences (Nadiri and Gunay, 2013).
Experiential value is not influenced by feel experience. The result a priori can be perceived as astounding regarding the previous researches (e.g. Yang and He, 2011; Mattila 2001; Kanopaite, 2015). The entertainment place, Riyadh Winter Wonderland itself as a brand or place to entertain not stimulates strong emotions among Saudi customers. Research participants associate the emotion experienced to the sense experience. Saudis may be excited to visit place entertainment, but in consumption they link feelings to senses. The nature of shows, games, food and drink areas offered are emotional sources, because they appeal senses.
Research outcomes demonstrated that both think as well as act experiences not generate emotional value. Theme park visit seems not enough simulating visitors’ cognitive thinking and the physical experience appears not altering their behaviors during the service consumption; they are cognitively passive and indifferent toward tangible aspect of the entertainment proposed. 66.9% of the current experiment respondents were between 18 and 25 years old. For this younger generation that has grown up with sophisticated technologies (e.g. internet, cell phones, video game, iPodos), animatronics (e.g. 3D, animated figures) employed by theme parks are perceived as old fashionedand outdated (Stein and Georges, 2009). Therefore, youth people are cognitively passive in theme parks and physical interaction with the tangible aspect of services not modify their impression, so the experiential value from consumption is weak or does not exist. According findings, the relate experience did not produce emotional value. Respondents not consider their visits to Winter Wonderland reinforcing relations with other or strengthen thinking about social activities, especially inside the theme park. Nowadays, for many people, it is more important to share virtually experiences through social networking than to live them in the entertainment place.
By examining antecedents of experiential emotional value in the entertainment industry, the current study offers insights for a successful implementation of experiential marketing. The recommendation is that professionals should focus on the sense experience to create memorable experience and enhance customers’ satisfaction. Contrary to the four experiences feel, act, think and relate, only sense experience has a significant impact the on emotional value and contributes satisfaction improvement. Therefore, a sensory strategy is essential Riyadh Winter Wonderland's visitors. Practitioners should appeal clients’ sense of sight by an attractive visual environment. First, virtual reality shows with a creative lighting are creative way to engage clients' visually. Second, to simulate hearing it is important to select a bundle of suitable soundtrack to immerse customers in a magic atmosphere. Understanding attendees’ preferences in term of music style is a key, culture and ethnicity should be considered. Third, selecting partners responsible for presenting food and beverage services is a critical part of a memorable taste experience. An escape from habitual food consumption can be an important element for outstanding experiences especially in the Saudi context. Moreover, managers can appeal to the smell sense by incorporating aromatherapy for improving psychological or physical well-being and push clients to spend more time in consuming. Similarly, materials used in installations or spaces can enhance the sense of touch that represents an effective way to lengthen time spent by visitors.
Finally, the study demonstrated that emotional value emerged from the sense experience improve significantly the satisfaction of the amusement park visitors. This finding is consistent with literature (Cronin et al., 2000; Ennew and Binks, 1999; Fornell et al., 1996; Kristensen et al., 2000; Patterson and Spreng, 1997; Yuan and Wu, 2008; Prakash, 2019; Prakash, 2019; Wu et al., 2018; Ihtiyar and Aras, 2020) and confirmed that experiential marketing and experiential value are the bases to construct customer satisfaction.
5.1. Limitations and Future Research
The paper findings should be viewed in light of some limitations that restrict this study and could be considered in future research. For instance, utilitarian, social, and altruistic dimensions of the experiential value are not considered. By the same token, this research does not take into account the impact of service quality on satisfaction. Thus, it could be useful to pay attention to such variables in future studies. Further, due to convenience sampling method used, findings cannot be generalized to Saudi population. It would be worthwhile to replicate the experimentation using a large sample. Finally, since it is the first experience of Saudis with a gigantic amusement park, it will be interesting to undertake qualitative research to gain a deep understanding of experiential marketing implementation and suggest clear managerial suggestions.
References
- Addis, M. and Holbrook, M. B., 2001. On the conceptual link between mass customization and experiential consumption: An explosion of subjectivity. Journal of Consumer Behavior, 1(1), pp.50-66.
- Amoroso, S., 2019. Chronicles of Consumer-Brand Experience: A Systematic Review and Research Agenda. International Journal of Marketing Studies, 11(1), pp.100-121.
- Andreassen, T. W. and Lindestad, B., 1998. Customer loyalty and complex services: The impact of corporate image on quality, customer satisfaction and loyalty for customers with varying degrees of service expertise. International Journal of Service Industry Management, 9, pp.7-23.
- Areni, S. C. and Kim, D., 1993. The influence of background music on shopping behavior: Classical versus top-forty music in a wine store. Advances in Customer Research, 20(1), pp.336-340.
- Batat, W., 2019. Experiential Marketing: Consumer Behavior, Customer Experience and The 7Es. London: Routledge.
- Bellizzi, J. A., Crowley, A. E., and Hasty, R. W., 1983. The effects of color in store design. Journal of Retailing, 59(1), pp.21-45.
- Bentler, P. M., 1990. Comparative fit Index in structural models. Psychological Bulletin, 107(2), pp.238–246. doi: 10.1037/0033-2909.107.2.238
- Berry, L. L., Carbone, L. P. and Haeckel, S.H., 2002. Managing the total customer experience. MIT Sloan Management Review, 43(3), pp.85-89.
- Brady, M. K. and Cronin, J. J., 2001. Customer orientation: Effects on customer service perceptions and outcome behaviors. Journal of Service Research, 3(3), pp.241-251.
- Brakus, J.J., Schmitt, B.H. and Zarantonello, L., 2009. Brand Experience: What Is It? How Is It Measured? Does It Affect Loyalty?. Journal of Marketing, 73(3), pp.52-68.
- Brand, R. R., Cronin, J. J. and Routledge, J. B., 1997. Marketing to older patients: Perceptions of service quality. Health Marketing Quarterly, 15(2), pp.1-31.
- Browne, M. W. and Cudeck, R., 1993. Alternative ways of assessing model fit. Sociological Methods & Research, 21(2), pp.230-258.
- Cachero-Martínez, S. and Vázquez-Casielles, R., 2017 Stimulating Curiosity and Consumer Experience in a Retailer. American Journal of Industrial and Business Management, 7, pp.473-486.
- Chang, H. J., Huang, C. W. and Lien, C. Y., 2012. Relationship models of experience satisfaction in residential refurbishment. African Journal of Business Management, 6(28), pp.8446-8458.
- Chou, H. J., 2009. The effect of experiential and relationship marketing on customer value: A case study of international American casual dining chains in Taiwan. Social Behavior and Personality, 37(7), p.998.
- Cronin, J.J., Brady, M.K. and Hult, G.T.M., 2000.Assessing the effects of quality, value, and customer satisfaction on consumer behavioral intentions in service environments. Journal of Retailing, 76, pp.193-218.
- Cuong, D. T., 2020.The Effect of Physical Environment and Perceived Value on Customer Satisfaction and Behavioral Intention at the Cinema in Vietnam. TEST Engineering and Management, 82, pp.1665-1674.
- DeVellis, R.F., 2012. Scale development: Theory and application. London: SAGE.
- Diamantopoulos, A. and Siguaw, A. J., 2000. Introducing LISREL. Thousand Oaks, CA: Sage.
- Didellon, L. and Valette-Florence, P., 1996. L’utilisation des indices d’ajustement dans les modèles d’équations structurelles: présentation et recommandation d’usage. Actes des XIIIèmes journées nationales des IAE.
- Edvardsson, B., 2005. Service quality: beyond cognitive assessment. Journal of Service Theory and Practice 15(2), pp.127-131.
- Engel, J. F., Blackwell, R. D. and Miniard, P. W., 1995. Consumer behavior (8th ed.). Forth Worth, TX: Dryden.
- Ennew, C. T. and Binks, M. R., 1999. Impact of participative service relationships on quality, satisfaction and retention: An exploratory study. Journal of Business Research, 46, pp.121-132.
- Fornell, C., Johnson, M. D., Anderson, E. W., Cha, J. and Bryant, B. E., 1996. The American customer satisfaction index: Nature, purpose, and findings. Journal of Marketing, 60(4), pp.7-18.
- Fornell, C. and Larcker, D.F., 1981.Evaluating structural equation models with unobservable variables and measurement error. Journal of Marketing Research, 18(1), pp.39–50.
- Garvin, D. A., 1984. What does product quality really mean?. Sloan Management Review, 26(1), pp.25-41.
- Gentile, C., Spiller, N. and Noci, G., 2007. How to sustain the customer experience: An overview of experience components that co-create value with the Customer. European Management Journal, 25(5), pp.395-410.
- Gooding, S. K. S., 1995. Quality, sacrifice, and value in hospital choice. Journal of Health Care Marketing, 15(4), pp.24-31.
- Grönroos, C., 2006. On defining marketing: finding a new roadmap for marketing. Marketing Theory, 6(4),395–417
- Grönroos, C., 2008. Service logic revisited: who creates value? And who co-creates?. European Business Review, 20(4), pp.298-314.
- Grönroos, C., 2011. Value Co-creation in Service Logic. A critical analysis. Marketing Theory, 11(3), pp.379-301
- Grönroos, C. and Ravald, A., 2011. Service Business Logic: Implications for Value Creation and Marketing. Journal of Service Management, 22(1), pp.5-22.
- Hair, J.F.J., Black, W.C., Babin, B.J., Anderson, R.E. and Tatham, R. L., 2006. Multivariate data analysis. New Jersey: Pearson Education.
- Hartline, M. D. and Jones, K. C., 1996. Employee performance cues in a hotel service environment: Influence on perceived service quality, value, and word-of-mouth intentions. Journal of Business Research, 35, pp.207-215.
- Heinonen, K., 2004. Reconceptualizing customer perceived value – the value of time and place. Managing Service Quality, 14 (2/3), pp.205-215.
- Heinonen, K, and Strandvik, T., 2009. Monitoring value-in-use of e-service. Journal of Service Management, 20(1), pp.33-51.
- Heinonen, K., Strandvik, T., Mickelsson, K-J., Edvardsson, B. Sundström, E. and Andersson, P., 2010. A customer dominant logic of service. Journal of Service Management, 21(4), pp. 531-548.
- Heinonen, K., Strandvik, T.,and Voima, P., 2013. Customer dominant value formation in service. European Business Review, 25 (2), pp.104-123.
- Holbrook, M. B., 2000. The millennial consumer in the texts of our times: Experience and entertainment. Journal of Macro marketing, 20(2), pp.178-192.
- Hu, L. and Bentler, P. M., 1999. Cutoff criteria for fit indexes in covariance structure analysis: Conventional criteria versus new alternatives. Structural Equation Modeling, 6, pp.1-55.
- Hui, M. K. and Bateson, J. E. G., 1991. Perceived control and the effects of crowding and consumer choice on the service experience. Journal of Consumer Research, 18(2), pp.174–184.
- Ihtiyar, A., Barut, M. and Ihtiyar, H. G., 2019.Experiential marketing, social judgements, and customer shopping experience in emerging markets. Asia Pacific Journal of Marketing and Logistics, 31(2), pp.499-515.
- Ismail, A. R., 2011. Experience marketing: An empirical investigation. Journal of Relationship Marketing, 10(3), pp.167–201.
- James, L. R., Mulaik, S. A. and Brett, J. M., 1982. Causal Analysis: assumptions, models and data. Beverly Hills, CA: Sage.
- Klaus, P. P. and Maklan, S., 2013. Towards a better measure of customer experience. International Journal of Market Research, 55(2), pp.227-246.
- Kristensen, K., Martensen, A. and Gronholdt, L., 2000. Customer satisfaction measurement at Post Denmark: Results of application of the European Customer Satisfaction Index Methodology. Total Quality Management, 11, 1007-1015.
- Kumar, V., 2015. Evolution of marketing as a discipline: What has happened and what to look out for. Journal of Marketing, 79(1), pp.1-9.
- Lee, S. H., Chang, S. C. and Hou, J. S., 2008.Night market experience and image. International Journal of Culture, Tourism and Hospitality Research, 2(3), pp.217-233.
- Lee, E. J. and Overby, J. W., 2004.Creating value for online shoppers: Implications for satisfaction and loyalty. Journal of Consumer Satisfaction, Dissatisfaction and Complaining Behavior, 17, pp.54-67.
- Li, L. Y. and Lee, L. Y., 2016. Experiential consumption and customer satisfaction: moderating effects of perceived values. International Journal of Marketing Studies, 8(5), pp.32-40.
- Maghnati, F., Choon Ling, K.and Nasermoadeli, A., 2012. Exploring the Relationship between Experiential Marketing and Experiential Value in the Smartphone Industry. International Business Research, 5(11), pp.169-177.
- Maklan, S. and Klaus, P., 2011. Customer experience: are we measuring the right things?. International Journal of Market Research, 53(6), pp.771–792.
- Mathwick, C., Malhotra, N. and Rigdon, E., 2001. Experiential value: Conceptualization, measurement and application in the catalog and Internet shopping environment. Journal of Retailing, 77(1), pp.39-56
- McCole, P., 2004. Refocusing marketing to reflect practice the changing role of marketing for business. Marketing Intelligence and Planning, 22(5), pp.531-539.
- Nunally, J. C. and Bernstein, I. H., 1994. Psychometric theory (3rd ed.). New York: McGraw-Hill.
- Patterson, G. P. and Spreng, A. R., 1997. Modeling the relationship between perceived value, satisfaction and repurchase intentions in a business-to-business, service context: An empirical examination. International Journal of Service Industry Management, 8(5), pp.415-432.
- Pine, B. J., II. and Gilmore, J. H., 1998. Welcome to the experience economy. Harvard Business Review, 76(4), pp.97-105.
- Prakash, G., 2019. Understanding service quality: insights from the literature. Journal of Advances in Management Research, 16(1), pp.64-90.
- Roussel, P., Durrieu, F., Campoy, E. and El Akremi, A., 2002. Methodes d’Equations Structurelles: Recherche et Application en Gestion. Paris: Editions Economica, Collection Recherche en Gestion.
- Schmitt, B., 1999. Experiential marketing. Journal of Marketing Management, 15(1-3), pp.53-67.
- Schmitt, B., 2012. The consumer psychology of brands. Journal of Consumer Psychology, 22(1), pp. 7-17.
- Schmitt, B. H., 1999. Experiential marketing: How to get customers to sense, feel, think, act, and relate to your company and brands. New York: Free Press.
- Shah, I. A., Rajper, Z. A., Ghumro, I. A. and Mahar, S. W., 2019. Experiential value mediates relationship between Experiential Marketing and Customer Satisfaction. Sukkur IBA Journal of Management and Business, 5(2), pp.45-61.
- Skandalis, A., Byrom, J. and Banister, E., 2019.Experiential marketing and the changing nature of extraordinary experiences in post-postmodern consumer culture. Journal of Business Research, 97, pp.43-50.
- Soares, A.M. and Elmashhara, M.G., 2020. Emotional, Sensory and Social Dimensions of Consumer Buying Behavior. IGI Global.
- Spangenberg, E. R., Crowley, A. E. and Henderson, P. W., 1996. Improving the store environment: Do olfactory cues affect evaluations and behaviors?. Journal of Marketing, 60(2), pp.67–80.
- Sweeney, J. C., Soutar, G. N. and Johnson, L. W., 1997. Retail service quality and perceived value: A comparison of two models. Journal of Retailing and Consumer Services, 4, pp.39-48.
- Vargo, S. L. and Lusch, R. F., 2004. Evaluating to a new dominant logic for marketing. Journal of Marketing, 68(1), pp.1-17.
- Voima, P., Heinonen, K., Strandvik, T., Mickelsson, K-J. and Arantola-Hattab, J., 2011. A customer ecosystem perspective on service. QUIS12 Advances in Service Quality, Innovation and Excellence, June 2‐5, 2011, Ithaca, New York.
- Warde, A., 2017. Consumption: A Sociological Analysis. London: Palgrave Macmillan.
- Wang, C. Y., and Lin, C. H., 2010.A study of the effect of TV Drama on Relationships among Tourists’ Experiential Marketing, Experiential Value and Satisfaction. International Journal of Organizational Innovation, 2(3), pp.107-123.
- Williams, A., 2006. Tourism and hospitality marketing: fantasy, feeling and fun. International Journal of Contemporary Hospitality Management, 18(6), pp.482-495.
- Wu, C. H. J. and Liang, R. D., 2009.Effects of experiential value on customer satisfaction with service encounters in luxury-hotel restaurants. International Journal of Hospitality Management, 28(4), pp.588.
- Wu, H. C., Li, M. Y. and Li, T., 2018.A study of experiential quality, experiential value, experiential satisfaction, theme park image, and revisit intention. Journal of Hospitality and Tourism Research, 42(1), pp.26-73.
- Yeh, T. M., Chen, S. H. and Chen, T. F., 2019.The relationships among experiential marketing, service innovation, and customer satisfaction—A case study of tourism factories in Taiwan. Sustainability, 11(4), pp.1041.
- Yuan, Y. H. E. and Wu, C. K., 2008. Relationships among experiential marketing, experiential value, and customer satisfaction. Journal of Hospitality and Tourism Research, 32(3), pp.387-410.
- Yu, H. and Ko, H.-T., 2012. Integrating Kano model with strategic experiential modules in developing ICT-enabled services: An empirical study. Management Decisions, 50(1), pp.7-20.
Article Rights and License
© 2020 The Authors. Published by Sprint Investify. ISSN 2359-7712. This article is licensed under a Creative Commons Attribution 4.0 International License.