Keywordsadvertising attractive display flea market pricing promotional strategies Word of mouth
JEL Classification M31
Full Article
1. Introduction
The concept of the flea markets has gained renewed attention in the literature. Gone are the days when flea markets were stigmatised and only reserved for low-cost consumers and traders. Flea markets are now widely used by consumers who are fascinated by the experience of buying at flea markets and finding interesting items.
1.1.Background to the Problem
Rupolia et al. (2015) stated that the adoption of the informal sector businesses, particularly small businesses, has increased tremendously in the developing and the developed economies in the last few decades. The flea markets business model is one form of a small business venture (Kallier, 2017). Flea markets business originated from a jocular term for an open-air or street markets for used products; the kind of items that may be infected with ‘fleas’ and hence the term ‘flea markets’. The selling of the used products, low-quality products, as well as some vintage products at low cost, are normal highlights of flea markets (Nabi and Kashif, 2016). Unlike in the traditional shopping centre environment, the line between the consumers and traders in flea markets may be blurred because traders shift from being traders to consumers and vice versa (Ha, 2014). Many small business traders are using some or other type of advertising and promotional strategy to attract potential buyers but there is no clear evidence of which strategies are effective in a flea market context.
1.2. Problem Statement
Traders and consumers at the Car Boot Flea Market situated in Durban, South Africa, meet every Sunday to buy and sell mostly used merchandise at a cheaper price than new items. The Car Boot Flea Market only provides open space for traders with no further assistance in the form of display tables, chairs, banners, umbrellas, tents or any other marketing material. The market itself is not well-organised such that traders that are selling related products are grouped in one section. Traditional marketing theories and strategies are not implementable by flea marketers in particular mainly due to inadequate skills and lack of finance (Rupolia et al., 2015). The study aims to identify the advertising and promotional strategies used by traders at the Car Boot Flea Market, in Durban, South Africa and to determine the extent to which such strategies affect the consumers’ buying decisions.
2. Literature Review
2.1. Informal Business Sector in South Africa
Small businesses in the informal sector, like those working at flea markets, are vitally important as they help to stimulate economic growth and lower the levels of poverty (Akintola and Akintola, 2015; Welter et al., 2015). To support small businesses, various exemptions exist in the areas of tax and employment and there is support from agencies like the small enterprise development association (SEDA). However, there is a still a lack of good education among informal traders with only 5 percent of the individuals in possession of a tertiary education degree or a diploma while 25 percent only have a matric certificate (The Real Economy Bulletin, 2017; Motsetse, 2015).
2.2. Flea Markets as a Business Model
According to Nabi and Kashif (2016), flea markets are unusual and fascinating outdoor markets that operate differently from the brick and mortar retailers. Current trends in consumerism show that there has been an increase in the adoption of flea markets worldwide and the increase has had an essential contributor towards developing the informal sector (Venter de Villiers et al., 2016). There are three common forms of flea markets that are found around the world viz. permanent flea markets, flea markets that operates only on weekends, and car boot flea markets (Chivivi et al., 2014).
2.3. General Demographics of Flea Market Consumers and products
Ha (2014, p.18) found that flea market consumers are of different ages, occupations and cultural backgrounds. Consumers include both local people and touring visitors searching for the best deal and having various levels of income (Chivivi et al., 2014; Rupolia et al., 2015). Flea market traders sell different kinds of products such as clothing, beddings, disks, towels, bicycle, shoes, laptops, computers, bags, fast food, disks, books, vehicle parts, clothing, and many more (Akintola and Akintola, 2015). Some traders sell at flea markets to make money to sustain a living while others regard it just as leisure time and socialisation (Ha, 2014).
2.4. Factors that Affect the Purchase Intention of Used Goods
According to Alam and Hulten (2014), consumers’ decisions to buy or not buy used goods is influenced by factors such as branding, pricing, associated risk, and location of the flea market. Venter de Villiers et al. (2016) revealed that flea markets are generally favoured by millennials or generation ‘Y’; the people born in the years between 1982 and 2002, who frequent the flea markets to acquire stylish or branded used clothes as popular branded items generate trust in the minds of consumers. The traders’ task is to build a positive image (Alam and Hulten, 2014) although consumers want great value from a product, or service, but are usually not keen to pay a high price (Ha, 2014). Traders on the other hand endeavours to set a price, without consumers’ direct control, after taking into consideration cost, percentage margin of profit and other factors such as the possibility of the consumers not buying if the product is set at a high price (Rupolia et al., 2015). Product quality and the risk of purchase plays an important role too (Alam and Hulten, 2014, p.21; Feng et al., 2010; Shi et al., 2013; Venter de Villiers et al., 2016).
2.5. Challenges Associated with Buying and Selling at Flea Markets
Rupolia et al. (2015) advised that infrequent consumers have ethical concerns about the products sold at the flea markets and in the recent past, some flea markets were also associated with criminal activities and are regarded as a place to sell counterfeit as well as stolen products (Amoah-Mensah, 2016). Furthermore, some communities living near the flea market location blamed the flea market for contributing toward increasing litter and traffic volumes (Riveira, 2013).
2.6. Traditional Marketing: Marketing Mix in a Flea Markets Context
Flea markets are generally small uncommon and fascinating business entities that work in an unconventional manner compared to the traditional retailers (Nabi and Kashif 2016). In large businesses, traditional advertising and marketing plans make use of communication tools such as pamphlets, magazines, posters, television and radio adverts, local newspapers and business cards (Kallier, 2017). Such traditional advertising and promotional strategies are not suited for small businesses, because small businesses, including flea markets, practice unique marketing as dictated by the degree of activities and level of rivalry the small businesses are facing (Resnick et al., 2016). In order to survive, small businesses have to come up with an alternative approach to marketing. Marketing initiatives are usually informal, reactive and based on intuition and usually organised by the owner or manager so marketing is largely treated as a secondary activity (Resnick et al., 2016; Rupolia et al., 2015; Seyyedamiri and Faghih, 2015).
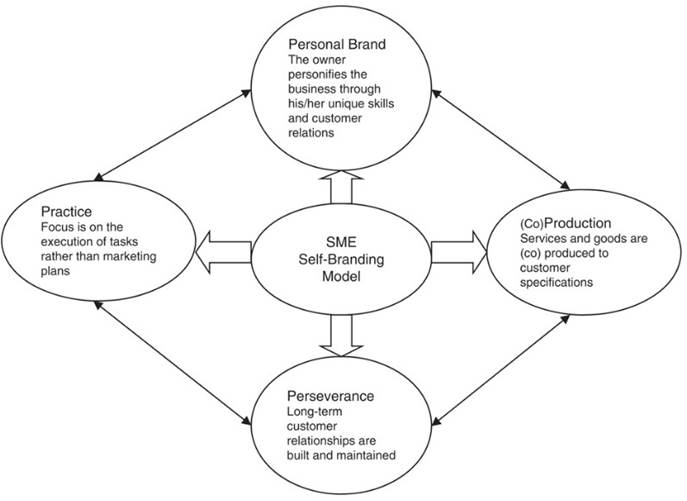
Figure 1. A 4Ps Model for Small Medium Enterprises Self-Branding
Source: Adapted from Kallier (2016, p.142)
In the small business context, personal branding is the heart of marketing because of the interdependency of the owner to conduct business in the highly competitive small business marketplace (Resnick et al., 2016). Traders in flea markets must persevere even though they usually have no marketing plan and often adopt self-marketing to make themselves known in the marketplace. However, marketing remains an essential component for a successful business (Franco et al., 2014; Resnick et al., 2016; Venter de Villiers et al., 2016).
2.7. Effects of Promotional Strategies on Buying Decisions
Small businesses become successful by offering to sell goods and services that keep consumers interested and to increase the chances of repeat buying (Cant and Wiid, 2016). For example, research conducted at an Apparel Street Flea Market found that Word of Mouth (which allows for direct customer interaction) was the most effective strategy followed by Attractive Display and then Personal Selling (Rupolia et al., 2015).
3. Research Methodology
A positivist philosophy underpinned the quantitative research method applied to the study (Van Wyk, 2015; Choy, 2014; Salvador, 2016; Bhattacharjee, 2012). All consumers who visit the Car Boot Flea Market every Sunday in Durban were considered to be the target population from which a suitable sample could be drawn. A descriptive research approach was followed (Neuman, 2014; Hasheela, 2016; Kumar, 2011). The Durban Car Boot Flea Market attendance was estimated to be 700 to 1000 each Sunday. A non-probability convenience sample of 158 market attendees was planned as the target population was only available for a very short space of time and there was a need to collect data quickly (Bryman, 2012). The sample consisted of consumers who visited the Car Boot Flea Market at least once over a six-week period of data collection. Unfortunately, only 105 questionnaires (66,5%) were returned in complete and acceptable form (Saunders et al, 2009; Choy, 2014; Alexey, 2015; Dabula, 2016; Van Wyk, 2015; Babbie, 2013). Ten (10) participants from the target population were conveniently selected to complete the questionnaire as a pilot study. The questionnaire used a five-point Likert scale to delimit answers. These were slightly amended after feedback from the pilot study. Cronbach’s alpha was used to test reliability and validity of the survey instrument (Bryman and Bell, 2011; Sampson, 2017; Bryman, 2012; Saunders et al., 2009).
During the six Sundays selected for data collection, the researcher was physically able to distribute questionnaires and collect them back on the same day but a language barrier was noted as some respondents were not able to read and fully understand the questionnaire which was only prepared in English. The researcher verbally translated the questions to the respondents in the languages that allow consumers to complete the questionnaires while being cautious to remain neutral and avoid any bias (Akaranga and Makau, 2016; Bhattacharjee, 2012; Saunders et al. 2009).
3.1. Data Analysis
The primary responses were captured on a Microsoft Excel spreadsheet and later transferred into the Statistical Package for the Social Science (SPSS) 2.1 to generate frequency tables and charts. As descriptive research is concerned with the current status of something viz. the Durban car boot flea market. Data collection continued over 6 consecutive Sundays which helped to improve reliability of the results (Heale and Twycross, 2015) The researcher acknowledged that the results were not generalisable due to the limitations of the descriptive survey method and taking a convenience sample rather than a random sample (Bhattacharjee, 2012; Mahlangu, 2017).
4. Results, Discussion and Interpretation of Findings
4.1. Demographics of respondents
The largest percentage of the gender of respondents was female at 67.6%. There were only 32.4% of respondents who were male. Figure 2 below shows the distribution of respondents by age. The first three largest percentage of respondents fall within the age category of 16-24 years (29.5%), followed by 25-33 years category (21.9%), and 34-42 years category (19.0%). The smallest percentages was from 43-51 years (11.4%).
The highest percent of respondents were in the age category 16-24 years and 25-33 years collectively which is consistent with the study by Venter de Villiers et al. (2016) who noted that the flea markets are favoured by millennials or Generation Y; people born in the years between 1982 and 2002.
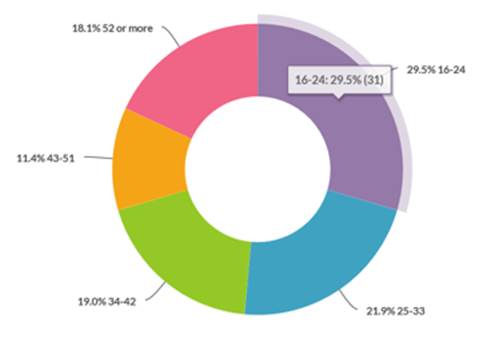
Figure 2. Percentage Respondents by Age
Distribution of Respondents by Occupation
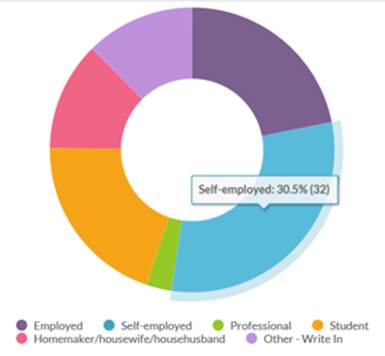
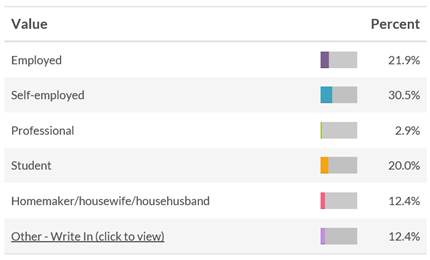
Figure 3 (below) shows the distribution of respondents by occupation. The majority of the respondents were self-employed at 30.5%, followed by employed at 21.9% and the students at 20%. The homemaker/housewife/househusband and professional occupations were the groups of consumers found to be least likely to shop at the flea market at 12.4% and 2.9% respectively. The highest respondents’ occupation type is self-employed at 30.5%, followed by employed at 21,9% and then student at 20%.
|
|
Figure 3. Percentage of Respondents by Occupation
4.2. Buying Patterns
Buying at the Flea Market - Frequency of Buying at the Flea Market
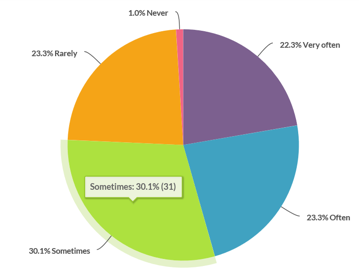
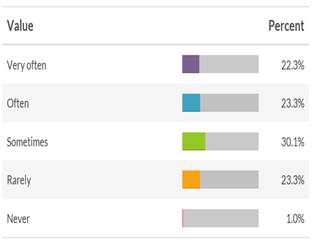
Figure 4 shows the distribution of respondents by frequency of buying at the flea market. The results show that at least 75% of the consumers who visits flea market buy when they get to the market. 22.3% buy very often, 23.3% buy often and 30.1% buy sometimes. The rest of the consumers either buy rarely or not at all. Mele et al. (2015) observed that, unlike malls, flea markets welcome everyone and there is no need to meet standards in order to fit in.
|
|
Figure 4. Percentage of Respondents by Frequency of Buying at the Flea Market
Reasons to Buy at the Flea Market
Figure 5 showed the distribution of respondents by underlining reasons to buy at the flea market. The results show that the majority of the respondents buy at the flea market in order to save money (59.6%). The second largest percentage of respondents at 30% buy because they find interesting items while 13% buy at the flea market because it is a fun activity. The results are consistent with the observation by Petrescu and Bhatli (2013) who stated that the low prices, finding interesting products and the need for fun to be the major reasons for buying at the flea market.
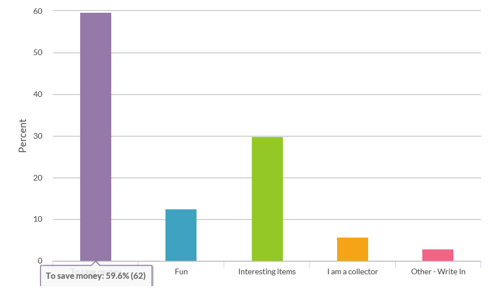
Figure 5. Percentage of Respondents by Reasons to Buy at the Flea Market
Products Categories Consumers Buy at the Flea Market
Figure 6 showed the distribution of respondents by products categories they frequently buy at the flea market. The findings of the study indicate that while personal use (47.1%), home (27.5%) and foods (27.0%) were amongst the top three preferred products categories, other categories like electricity (TV, laptop, cellphones) and leisure (hobbies, games, CDs) were also commonly chosen by flea markets consumers. The finding of this study agrees with the finding of the study conducted by Alam and Hulten (2014) that focused on the sale of the second-hand goods, and noted that the personal use items (for example: clothes, shoes, mirror, jewellery, handbag, bags, and earrings) sells the most compared to other categories.
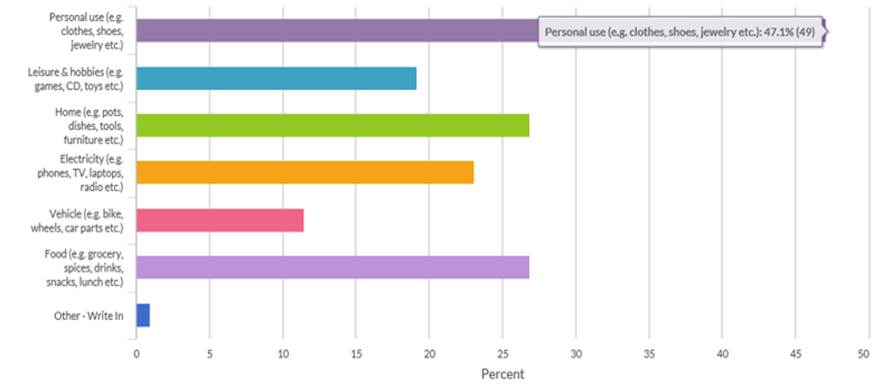
Figure 6. Percentage of Products Categories Consumers Buy at the Flea Market
Advertising and Promotion at Flea Market - Factors that Attract Buying at the Flea Market
Figure 7 shows the distribution of respondents by factors affecting buying decision. The results show that significant number of respondents (52.9%) prefers to buy from sellers with good characteristics or reputations. Another factor is buying from the sellers that have a good knowledge of the products they are selling (32.1%). At the initial stages, both parties do not know each other’s habits, however, as the parties build a rapport, they are able to make each other better deals.
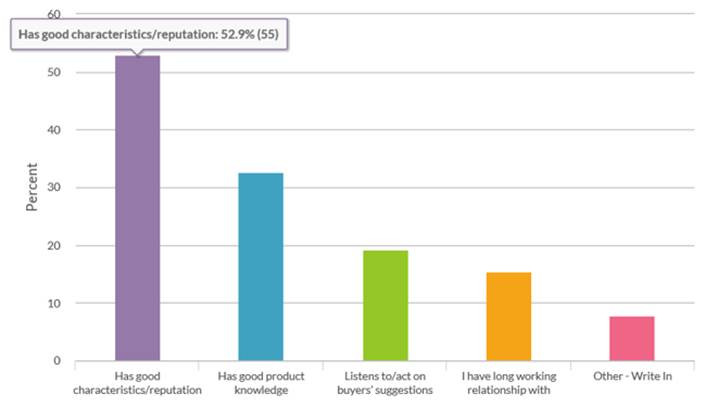
Figure 7. Percentage of Respondents by Factors that Attract Buying at the Flea Market
How the respondents found out about the Flea Market
Table 1 above shows the distribution of respondents by how they found out about the Durban Car Boot Flea Market. The table depicts that the majority of the respondents found out about the market through friends and families (57%). Meanwhile, (15.2%) saw the market while passing by and only (13.3%) heard about flea market through the radio, TV or Newspaper advertisements. The findings concur with Petrescu and Bhatli (2013) who showed that consumers who visit flea markets are often invited by friends or families.
Table 1.Number and Percentage of Respondents by how they found out about the Flea Market
| How Respondents Found Out about the Market | Frequency | Percentage |
| Radio/TV/Newspaper advertisements | 14 | 13.3% |
| Street banners/pamphlets | 6 | 5.7% |
| Internet search/Social media | 6 | 5.7% |
| From a friend/family | 60 | 57.1% |
| Just passing by | 16 | 15.2% |
| Other - Write In | 3 | 2.9% |
| Total | 105 | 100% |
Factors that Motivate Buying at the Market
Figure 8 depicts that although respondents mostly prefer to buy when they perceive that offer to be attractive (43.3%); a close percentage of respondents (41.3%) consider a clean eye-catching display to be almost equally important.
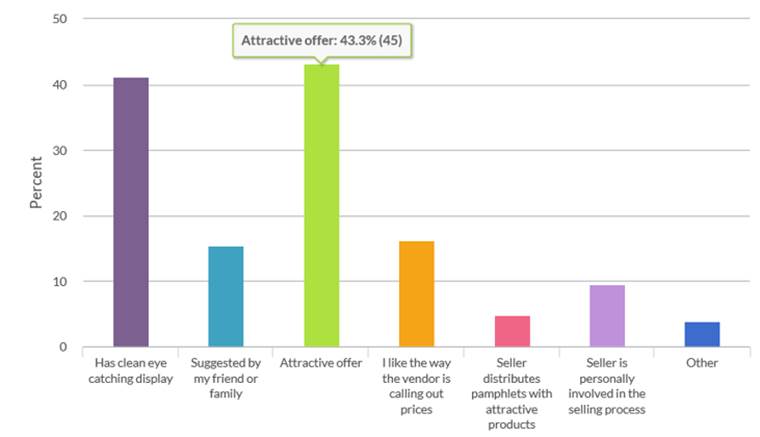
Figure 8. Number and Percentage of Respondents by Factors that Motivate Buying at the Market
Other factors such as suggested by friends or family, calling out prices, distributing pamphlets and being personally involved in the selling process all show percentages that are not more than 15%. The results of the current study differ from the results of the study conducted by Rupolia et al. (2015) that found that Positive Word of Mouth (Suggested by a Friend or Family) to be the most effective strategy for advertising followed by Attractive Display (Clean Eye-Catching Display) of goods.
When comparing the results depicted in Figure 8 with the results depicted in Table 1, it is clear that although consumers are invited by friends and families to the market, consumers rarely take suggestions from families and friends when deciding which products to buy.
Prices Influence Buying Decision at the Market
Table 2 shows the distribution of respondents by how the prices of products sold at the Car Boot Flea Market influence their buying decision. The table depicts that the respondents commonly buy when they see the price to be affordable. This finding is consistent with the finding in Figure 5 above that shows that consumers want to save money when they buy at the flea market.
Table 2. Number and Percentage of Respondents by How Prices Influence Buying Decision at the Market
| Influence of Price on Buying Decision | Frequency | Percentage |
| True | 91 | 86.7% |
| False | 14 | 13.3% |
| Total | 105 | 100% |
How Bargaining Influences Buying Decision at the Market
Table 3 shows that consumers often prefer to bargain (72%) for prices and better deal when buying at the flea market. There are consumers that are fascinated by the excitement of looking for interesting objects, hunt for treasure, search for bargains, the opportunity to negotiate terms and prices, and even the socialising, interaction, fun experience which is not offered by regular shopping centres, department stores and malls (Venter de Villiers et al., 2016). In contrast to the finding of the present study that seek to bargain with the aim of reducing prices or increasing the quantities, Gregson et al. (2013:17) observed that some consumers bargain because they are fascinated by the experience of bargaining even if they will end up throwing away the articles they secured after bargaining.
Table 3. Number and Percentage of Respondents by How Bargaining Influences Buying Decision at the Market
| Influence of Bargaining on Buying Decision | Frequency | Percentage |
| True | 76 | 72.4% |
| False | 29 | 27.6% |
| Total | 105 | 100% |
Product Respondents Seek Influences Buying Decision
Table 4 shows the distribution of respondents by how finding the products they seek influence their buying decision. The table depicts that respondents are not only driven by price and the need for bargaining, but they are also driven the desire to find interesting products. This finding compared well with the earlier study by (Venter de Villiers et al., 2016) who stated that consumers often buy what they have been looking for if they have been seeking such a product for a long time and also the excitement of looking for interesting objects.
Table 4. Number and Percentage of Respondents by How Finding the Product Respondents Seek Influences Buying Decision
| Influence of finding the product respondents seek on Buying Decision | Frequency | Percentage |
| True | 85 | 81% |
| False | 20 | 19% |
| Total | 105 | 100% |
5. Conclusions and Recommendations
5.1. Findings from the Literature Review
Reviewed literature confirms that flea markets are widely adopted by different classes of people in all walks of life (Rupolia et al., 2015). However, attracting consumers to the flea markets by applying the traditional principles of marketing and advertising and promotional strategies is difficult for flea market traders to implement (Nabi and Kashif, 2016). Chivivi et al. (2014) suggested that flea markets traders make use of colourful packaging and displays mostly visible on the tables of flea markets traders as opposed to throwing product items on the floor. A trader’s attitude can scare or attract consumers so flea market traders need to be friendly and happy to engage with customers. Since products sold at the market are usually second-hand products and consumers sometimes have doubts about the products’ quality and functionality because the products have been used before, traders should make an effort to give the consumers the assurance that the products on sale are functioning and are meeting the expected quality standards (Franco et al., 2014). Traders need to study the flea market competition and price the products appropriately (Chivivi et al., 2014). Traders should make an effort to give the consumers the assurance that the products on sale are not stolen, are functioning, and are meet an expected quality standard (Ramaseshan and Stein, 2014). The results showed that the practise of calling out prices, and using newspapers, radios and Internet in advertising at the flea markets are not effective.
5.2. Findings from the Primary Research
· What are the advertising and promotion strategies used by traders to influence consumers’ buying decision at the Car Boot Flea Market, in Durban?
Traders in the flea market use promotional strategies such as (a) Taking advantage of the word of mouth from consumers’ relatives and friends, (b) Distributing pamphlets with an attractive offer, (c) Presenting attractive offers, (d) Becoming personally involved in the selling process, (e) Calling out prices, (f) Presenting a clean eye-catching product display, (g) Offering opportunity to bargain, (h) Selling the right products that consumers are looking for (i) Offering an opportunity to test the product before buying and (j) Setting prices that consumers find affordable.
· To what extent are the advertising and promotional strategies used by traders to attract consumers at the Car Boot Flea Market influence consumers’ buying decision?
Table 5. Ranking of Advertising and Promotional Strategy
| Rank | Advertising and Promotional Strategy | Frequency | Total Responses | Percentage |
| 1 | Setting prices that consumers find affordable. | 92 | 105 | 87.6% |
| 2 | Presenting attractive offers | 79 | 105 | 75.3% |
| 3 | Selling the right products that consumers are looking for | 79 | 105 | 75.2% |
| 4 | Presents a clean eye-catching product display | 77 | 105 | 73.4% |
| 4 | Offering an opportunity to test the product before buying | 77 | 105 | 73.4% |
| 6 | Offering opportunity to bargain | 70 | 105 | 66.6% |
| 7 | Taking advantage of the word of mouth from consumers’ relatives and friends | 52 | 105 | 49.6% |
| 8 | Calling out prices | 51 | 105 | 48.6% |
| 9 | Becoming personally involved in the selling process | 48 | 105 | 45.7% |
| 10 | Distributing pamphlets with attractive offer | 44 | 105 | 41.9% |
The ranking above indicates that affordable prices are the main criteria for buying at the Durban Car Boot Flea Market while distributing pamphlets was the lowest ranked order of priority in the minds of the consumers.
5.3. Managerial Implications
The results of the study show that consumers are price sensitive. Consumers are also sceptical about the products for sale so flea market traders must make an effort to ensure it is presentable and working as intended. Traders should invest in learning more about the needs of the consumers that they are selling to, develop good reputation in the market, and attempt to achieve a good balance of the product quality and the price. The quality of the product is with respect to the functionality and authenticity or how presentable the product that they sell are. Earlier studies suggesting word of mouth to be the most effective strategy are not consistent with the finding of this study and therefore should be applied with caution. Although there is a strong need to save money there is also another side that indicates that consumers’ needs are not entirely controlled by price. Traders who are able to balance the need for the right products at the right price are more likely to sell more. Traditional marketing activities like calling out prices, issuing pamphlets and using other forms of tactics to attract consumers have little effect on the consumers’ decision to buy at the market. Flea markets traders need to be able to tailor-make their promotional messages to specific segments and thus make it easier for consumers to find goods of interest.
5.4. Limitations and Future Research
The area of research that the future studies should focus on is the role of the factors such as the social network in stimulating the advertising and promotion in the flea market context. The study was limited by only selecting categories of products that consumers prefer to buy without going into further detail about the reason/s they prefer one category above the other. Consumers do not only focus on one category but generally buy from different product categories, although slightly more on the personal use items, home items, and food items, because these are general always available at flea markets. It was also not within the scope to consider risks, such as counterfeit products, return policy, possibility of stole/illegal/expired goods, and no warranty. Future research should consider the influence of such factors on flea market consumer behaviour.
References
- Akanga, S.I. and Makua, B.K., 2016. Ethical Considerations and their Applications to Research: A Case of the University of Nairobi. Journal of Educational Policy and Entrepreneurial Research, 3(12), pp.1-9.
- Akintola, O. and Akintola, O., 2015. West Africans in the Informal Economy of South Africa: The Case of Low Skilled Nigerian Migrants. The Review of Black Political Economy, 42(4), pp.379-398.
- Alam, D., 2014. Factors that Influence the decision when buying second-hand products!. Master Thesis. Umea: University School of Business and Economics (USBE) Department of Marketing, Sweden.
- Alexey, A., 2015. Promotional plan for the small business company in conditions of current crisis. Case company. Master Thesis, RENE: Saimaa University of Applied Sciences, Finland [online] Available at: https://www.theseus.fi/bitstream/handle/10024/101071/Antonov_Alexey.pdf?sequence=1 [Accessed on 24 May 2018].
- Amoah-Mensah, A., 2016. Street Vending and Competitive Advantage: Towards Building a Theoretical Framework. The Qualitative Report. [online] Available at: https://nsuworks.nova.edu/cgi/viewcontent.cgi?referer=https://www.bing.com/&httpsredir=1&article=2438&context=tqr [Accessed on 09 May 2018].
- Babbie, E., 2013. The Practice of Social Research. 13th ed. Belmont, CA: Wadsworth
- Bhattacharjee, A., 2012. Social Science Research: Principles, Methods and Practices [online] Available at: http://scholarcommons.usf.edu/oa_textbooks/3 [Accessed on 31 May 2018].
- Bryman, A., 2012. Social research methods. 4th ed. Oxford, UK: Oxford University Press.
- Bryman, B. and Bell, E., 2011. Business Research Methods. 3rd ed. Oxford, UK: Oxford University Press.
- Cant, M.C. and Wiid, J.A., 2016. The use of traditional marketing tools by SMEs in an emerging economy: A South African perspective. Problems and perspective Management, 14(1), pp.64-70.
- Chivivi, O.O., Moyo, P. and Mapuwei, N., 2014. Advertising Strategies and Tactics Applied by the Flea Market Traders to Alleviate Poverty in Zimbabwe. Case of Mupedzanhamo (Harare) and Global Flea Market (Gweru). European Journal of Business and Management, 6(27), pp.22-29.
- Choy, L.T., 2014. The Strengths and Weaknesses of Research Methodology: Comparison and Complimentary between Qualitative and Quantitative Approaches. IOSR Journal of Humanities and Social Science, 19(4), pp.99-104
- Dabula, N., 2016. The influence of social media political marketing on trust, loyalty and voting intention of youth voters in South Africa. Master Thesis, Wits Business School, South Africa.
- Fatoki, O., 2014. The financing options for new small and medium enterprises in South Africa. Mediterranean Journal of Social Science, 5(20), pp.748-755.
- Feng, T., Keller, L. R., Wang, L. and Wang, Y. (2010). Product Quality Risk Perceptions and Decisions: Contaminated Pet Food and Lead-Painted Toys. Risk Analysis, 30(10), pp.1572-158.
- Franco, M., Santos, M.F., Ramalho, I. and Nunes, C., 2014. An exploratory study of Entrepreneurial marketing in SMEs. Journal of Small Business and Enterprise Development, 21(2), pp.265–283.
- Gregson, N. and Crang, M. and Laws, J. and Fleetwood, T. and Holmes, H., 2013. Moving up the waste hierarchy: car boot sales, reuse exchange and the challenges of consumer culture to waste prevention. Resources, conservation and recycling, 77, pp.97-107.
- Ha, N., 2014. Buy, Sell and Chatter: A Case Analysis of a Lisbon Flea Market. Master Thesis, School of Business and Economics, Portugal.
- Hasheela, S., 2016. The impact of development finance institutions on the growth of Small and Medium Enterprises in Windhoek. Master Thesis, Namibia Graduate School of Business University of Cape Town, South Africa.
- Heale, R. and Twycross, A., 2015. Validity and reliability in quantitative research. Evidence-Based Nursing, 18(3), pp.66-67.
- Kallier, S.M., 2017. The focus on marketing communication efforts of SMEs. Management and Marketing Journal, 12(1), pp.140-154.
- Kumar, R., 2011. Research Methodology: A Step-by-Step Guide for Beginners. 3rd Edition. New Delhi: Sage.
- Mahlangu, I., 2017. A Performance Measurement Framework to Enhance the Success and Survival of Retail Micro, Small and Medium Enterprises. Master Thesis, University of South Africa, South Africa.
- Mele, C., Ng, M. and Chim, M. B., 2015. Urban markets as a ‘corrective’ to advanced urbanism: The social space of wet markets in contemporary Singapore. Urban Studies, 52(1), pp.103-120.
- Motsetse, M.J., 2015. The role of government in developing sustainable SMEs in the construction sector in the Free State province. Master Thesis, University of Free State, South Africa.
- Nabi, M.K. and Kashif, M., 2016. Shoppers Perception towards Flea Markets: A Study of Weekly Flea Market of Old Delhi. Journal of Marketing Vista, 6(2), pp.1-7.
- Neuman, W. L., 2014. Social research methods: qualitative and quantitative Approaches. 7th ed. Harlow, Essex: Pearson.
- Petrescu, M. and Bhatli, D., 2013. Consumer Behavior in Flea Markets and Marketing to the Bottom of the Pyramid. Journal of Management Research, 13(1), pp.55-63.
- Ramaseshan, B. and Stein, A., 2014. Connecting the dots between brand experience and brand loyalty: The mediating role of brand personality and brand relationships. Journal of Brand Management, 21(7-8), pp.664-683. doi:10.1057/bm.2014.23
- Resnick, S.M., Cheng, R., Simpson, M. and Lourenço, F., 2016. Marketing in SMEs: a “4Ps” self-branding model. International Journal of Entrepreneurial Behaviour and Research, 22(1), pp.155-174, doi:10.1108/IJEBR-07-2014-0139
- Riveira, A.N., 2013. A Tale of Two Markets: The People and Culture of American Flea Markets. Master Thesis, Auburn University Graduate School, United States.
- Rupolia, M., Choudhary, R. and Purohi, H., 2015. A Study on Promotional Strategies Adopted by Apparel Street Vendors Influencing Customers shopping Decision. IOSR Journal of Business and Management, 3, pp.20-27.
- Salvador, T.J., 2016. Exploring Quantitative and Qualitative Methodologies: A Guide to Novice Nursing Researchers. European Scientific Journal, 12(8), pp.1857- 7881.
- Sampson, J.P., 2017. Guide to Quantitative and Qualitative Dissertation Research. Department of Educational Psychology and Learning Systems. 2nd Ed. Florida State University.
- Saunders, M., Lewis, P. and Thornhill, A., 2009. Research methods for business students. 5th Ed. Financial Times Prentice Hall. Harlow, England.
- Seyyedamiri N. and Faghih N., 2015. Studying entrepreneurial marketing for information technology SMEs based on the classic grounded theory. QScience Connect, 2015(1). doi: 10.5339/connect.2015.9
- Shi, H.; Liu, Y. and Petruzzi, N. C., 2013. Consumer Heterogeneity, Product Quality and Distribution Channels. Management Science, 59 (5), pp.1162-1176.
- The Real Economy Bulletin, 2017. The Real Economy Bulletin, Trends, Developments and Data - Special Edition: The State of Small Business in South Africa. [online[ Available at: http://www.tips.org.za/manufacturing-data/the-real-economy-bulletin/the-state-of-small-business-in-south-africa/item/3366-the-real-economy-bulletin-the-state-of-small-business-in-south-africa-2017 [Accessed on 10 August 2018].
- Van Wyk, M.M., 2015. Educational Research an African approach. Oxford University Press.
- Van Wyk, M.M. and Toale, M., 2015. Research design. Educational research: An African approach. Oxford University Press.
- Venter de Villiers, M., Visnenza, A. and Phiri, N., 2017. Importance of location and product assortment flea markets loyalty. The Service Industries Journal, 18, pp.1-19 doi:10.1080/02642069.2017.1410541
- Welter, F., Smallbone, D. and Pobol, A., 2015. Entrepreneurial activity in the informal economy: A missing piece of the entrepreneurship jigsaw puzzle. Entrepreneurship and Regional Development, 27(5-6), pp.292-306.
Article Rights and License
© 2021 The Authors. Published by Sprint Investify. ISSN 2359-7712. This article is licensed under a Creative Commons Attribution 4.0 International License.