Keywordsexpectancy-confirmation model motorists’ satisfaction SERVQUAL South Africa Thailand
JEL Classification M31
Full Article
1. Introduction
Since its introduction in the 1930s, marketing has drastically evolved through three major phases: from the emergence of mass market to the emphasis on relationship in the completion of transactions passing by the articulation of the modern marketing concept (Baker and Saren, 2010). The fulfilment of its essence of pursuing a mutually satisfying buyer-seller exchange relationship places customer needs and wants at the core of any strategy (Ayikwa, 2020). Provided services, such as goods, need to be centred on the relevant target audience in order to accomplish the desired level of satisfaction. The latter is determined through the balance between audience’s expectation and perceived performance in relation with the service rendered (Reisig and Chandek, 2001). Hence, the importance for service providers from private or public sector such as the Traffic Police Department to continuously measure the performance of their services to enable the managerial board to tackle issues and weaknesses that might lead to motorists’ dissatisfaction (Rossi and Aversano, 2015). However, measuring motorists’ expectations and related perceived performance in relation to traffic police services will only describe current levels, while decisions should rely on statistical inferences that have the power to establish and investigate relations between variables pertaining to the quality of such services.
Rightly or wrongly, road users across the world complain about traffic police officers’ unethical behaviours and malpractices, lack of positive socialisation, and lengthy files’ processing time that alter their trust on Traffic Police Departments. In order to make the necessary corrections to improve the quality of the services they offer; this study investigated the relationships between motorists’ level of satisfaction and biographical characteristics and SERVQUAL dimensions using an expectancy-disconfirmation model approach. Thus, it intended to identify correlational and predictive patterns of motorists’ satisfaction with Traffic Police Departments’ offerings to enable decision makers to touch on aspects that are likely to change motorists’ perception on services quality. The present study was conducted simultaneously in South Africa and Thailand. It described motorists’ expectations and perceived performance of service quality provided by Traffic Police Departments they are dealing with before performing the aforementioned analyses considering both the overall and country level stages to get insights. Results from these analyses will serve in re-strategizing traffic police departments’ way of serving motorists in order to meet their needs and reach successful police-motorist encounters.
2. Literature Review
It is a complex task to make a useful generalisation of management prerequisites for services as the sector is made up of a wide range of industries, operational in both the private and public sectors, offering diversified types of values to customers though they have many similar underlying characteristics (Verma, 2001). Besides aspects such as service providers creating values through little or no material transformation, high customers involvement in the production process and the inability to keep inventory, Cook et al. (1999) identify the following commonly accepted additional characteristics of services:
- Services are intangible.
- Services have time-perishable capacity.
- The customer is highly involved in the delivery process.
- Production and consumption take place simultaneously.
- There is relatively higher variability in operational inputs and outputs.
- The location of customers determines the site selection.
- Production is generally very labour intensive.
- Service outputs are relatively ever measured appropriately.
Improving the efficiency, productivity and effectiveness of public services across countries in the world have been an increasing concern that appealed to scholars and professionals to address the adequacy of performance measurement tools to be used in order to provide public servant managers with the capability to amend and adapt strategies to follow on internationally accepted quality service standards (Rossi and Aversano, 2015). The SERVQUAL measurement instrument, developed on the basis of the “gap” model proposed by Parasuraman et al. (1985), is widely acknowledged as the most suitable for the conceptualisation and operationalisation of the service quality and is used for measuring customers’ perceptions in service and retailing organisations. The aforementioned authors assert that service quality is the difference between customers’ expectations and their perceived level of performance regarding service delivery (Verma, 2001). Indeed, their model conceptualises the perceptions that a customer may have as a function of service encounter or delivery, an organisation’s communication directed to audiences, managers’ understanding of what customer expectations might be as well as its translation to specifications to be met by the service as shown in Figure 1. Therefore, motorists’ “satisfaction”, referring to their expectations and “performance” related to their perception of the quality level of the service delivered, emerge as being at the core of service quality in traffic police services (Mason, et al., 2019).
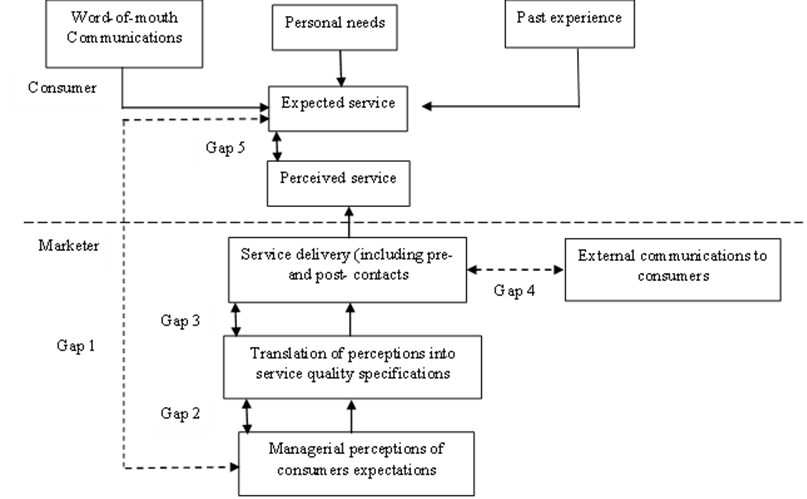
Figure 1. Service quality gap model
Source: Parasuraman et al., 1985
Motorists feel gratified and fulfilled by a traffic police department when their satisfaction arising from the perceived performance of the service exceeds their expectations (Shah and Regassa, 2010). The situation described above is called “ideal level of service”, where an equivalence relationship between expectations and perceived performance is judged to be “satisfactory” (Kurtz and Clow, 2007). Consequently, an unbalanced balance of power, unfavourable to the perceived performance of the service delivered, leads motorists to dissatisfaction. Formerly research was suggesting three alternative satisfaction models until Johnson et al. (1996) propose a fourth one referred to as the “expectations-artefact model.” The prior models developed are: the performance model, the disconfirmation model and the rational expectations model. All models are illustrated in Figure 2.
The very first service-quality model introduced is the expectancy confirmation/disconfirmation model, which is based on a comparison made by a motorist of his/her expectations and the current performance of the service delivered (Qu and Ping, 1999). It determines that “emotional satisfaction” occurs when performance exceeds expectations, while the opposite situation generates “emotional dissatisfaction” (Zhang, et al., 2022). The second model developed is merely an equity theory called the rational expectations model (Muth, 1961). This model hypothesises that the mean expectation of motorists interacting with a traffic police officer is equivalent to the service delivery of the traffic police department (Jewczyn, 2010). Indeed, weaknesses, inaccuracy and non-existence of individual motorist’s expectations for traffic service are weighted by the sum of all motorists’ expectations, which will turn out to be much closer to reality or rational (Johnson, et al., 1996). This model thus highlights the redundancy between expectations and performance (performance = expectations) (Delcey and Sergi, 2019). The third service-quality model acknowledged as a service performance model is based on the theory that the quality or performance of a traffic service can influence motorists’ satisfaction independently of their expectations and equity matters (Qu and Ping, 1999). A review by Mowen et al. (1995) of the three aforementioned models pointed out the limitation of factors that might influence motorists’ satisfaction/dissatisfaction in the expectancy confirmation/disconfirmation model as traffic police departments’ adverts and police officers might impact road users’ expectations. Likewise, some motorists expecting more service than their counterparts might have higher expectation standards (Zhang, et al., 2022). They noticed the difficulty of gathering all the information about traffic-related expectations and service quality delivered from both motorists and traffic police departments with regard to the rational expectations model (Jewczyn, 2010). However, Mowen et al. (1995) established the impact of performance on satisfaction independently from expectations towards an empirical study on a stock market selection investigating the incidence of service performance alongside attribution, expectations, and equity on satisfaction. Furthermore, they claimed that for unambiguous services and those that are easy to assess, perceived service performance directly influences motorists’ satisfaction/dissatisfaction.
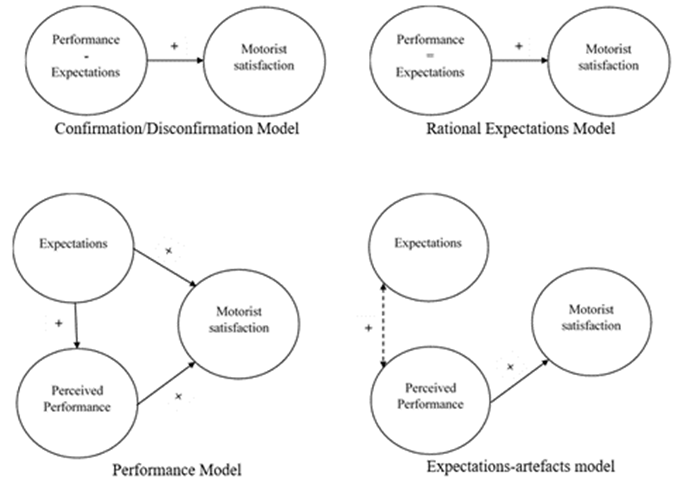
Figure 2. Alternative motorist satisfaction models
Source: Adapted from Johnson, M. D., Nader, G., and Fornelll, C. (1996).
The fourth model called the expectations-artefact model, on the other hand, questioned the adequacy of the three prior models in describing customers’ satisfaction for complex services such as money bank loans (Johnson, et al., 1996). Indeed, it is generally observed that customers hold low expectations for money lending, which expresses mostly an artefact of a complex, intangible, and rarely experienced service production process (Gunning, 2000). The expectations-artefact model assumes that expectations cannot influence satisfaction because they are not serving either as an anchor, as argued in the performance model, or a standard of comparison, as pretended in the expectancy confirmation/disconfirmation model, for assessing satisfaction (Browne and O'Donnabhain, 2000). Hence, perceived performance should be considered as the main determinant of satisfaction (Johnson, et al., 1996). Also, it is observed that perceived performance raises the reported customers’ expectations thus highlighting the covariance relationship between both.
The present empirical study follows an expectancy confirmation/disconfirmation model approach, based on balancing the measured motorists’ expectations and perceived performance regarding the six SERVQUAL dimensions viewed as factors to consider when evaluating the overall performance of traffic police service quality (Sarrico, et al., 2013); (Setiadjit and Utomo, 2016). Thus, the difference between perceived performance (PP) and expectations (EXP) within each dimension constitute the overall performance (OP) of traffic police service quality for that dimension (e.g., OPi = ∑ PPi - ∑ EXPi). In addition, it captures biographical data and measures the overall motorists’ level of satisfaction with regard to traffic police departments’ service quality in order to identify its predicting factors. Furthermore, correlational relationships between all considered factors are investigated to determine their nature and strength.
3. Research Methodology
3.1. Instrument
A structured self-administered questionnaire was developed through a compilation of items validated in studies conducted by Brysland and Curry (2001), Chatzoglou et al. (2013), Pollanen, (2005); Sarrico et al. (2013); Setiajit and Utomo (2016) in order to collect the data. The questionnaire was composed of three main parts. Part one gathered respondents’ biographical data. Part two measured their expectations and perceived performance regarding traffic police departments’ service quality in terms of the six dimensions considered by this study. Indeed, with no intention to revive the debate about researchers’ different views on how to measure service quality, the present study has opted for the SERVQUAL by Parasuraman et al. (1988) as its measurement instrument.
However, it is worth mentioning that the used instrument is the latest developed by the mentioned authors who after describing service quality on the basis of 10 dimensions that are: tangibles, reliability, responsiveness, communication, credibility, security, courtesy, competence, understanding customers, and assess (Parasuraman, et al., 1985), have amended it to five dimensions: tangibles, reliability, responsiveness, assurance and empathy to encompass the overlapping of categories and motorists’ inability to distinguish among the 10 categories (Qu and Ping, 1999). The sixth dimension (promptitude) considered applies to the specific context of motorists-police encounters (Sarrico, et al., 2013). Part three, for its part, asked respondents about their overall level of satisfaction with the traffic police departments which they are currently dealing with. All six dimensions — tangibility (7 items), reliability (8 items), promptitude (6 items), responsiveness (8 items), assurance (5 items), and empathy (6 items) — were scored on a five-points Likert-scale ranging from “not important at all” to “very important” for expectations, and “not good at all” to “excellent” for the perceived performance.
3.2. Sample Size and Sampling Plan
The study’s survey took place in Tshwane, South Africa and Khon Kaen, Thailand. A convenience sampling method was applied to select respondents randomly during their visit to a traffic police department and only individuals who volunteered to participate in this study were invited to complete the questionnaire, after a guarantee of anonymity and confidentiality was given. A sampling strategy setting a quota regarding the contribution of each country by half of the total size (516) was applied. Table 1 illustrates that the majority of respondents for the overall sample were male (52.9%), aged 18 to 29 years old (65.1%), having completed tertiary education (50.2%), and in possession of a driver’s license for less than 10 years (74.8%). Both South African and Thailand samples are in line with the overall profile aforementioned except for gender as most Thailanders’ respondents were female (57.0%).
3.3. Data Analysis
Apart from biographical variables, this study had thirteen variables relating to respondents’ expectations and perceived performance with regard to the six SERVQUAL dimensions considered and their overall level of satisfaction with traffic police departments’ service quality. The overall performances (OPs) of traffic police service quality were obtained by subtracting the sum of scores of expectations from the sum of scores of perceived performances within each dimension. Data transformation was used to create a 3-points Likert scale for OPs variables to reflect either “ideal (3)”, “satisfactory (2)” and “unsatisfactory (1)” levels of service quality.
A descriptive statistic of mean and standard deviation analyses was employed to describe the respondents’ OPs regarding each dimension and their overall level of satisfaction as illustrated in Table 2. Tetrachoric correlation coefficients were used to determine the nature and strength of relationships between biographical variables, OPs and overall level of satisfaction, as they were all measured as either nominal or ordinal data, while Pearson correlation was used for the statistical significance as shown in Table 3. The overall level of satisfaction was used as dependent variable and biographical and OPs were used as independent variables in an ordinary least square (OLS) regression to identify the impacts and relative importance of each factor on the motorists’ reported level of satisfaction as demonstrated in Table 4 to 6. All statistic tests were performed using SPSS version 27 except for tetrachoric (polychoric) correlations that were computed by the R Hetcor package.
Table 1. Demographic Profile of the Respondents (n = 516)
| Bio-characteristics | Frequency | Percent | Bio-characteristics | Frequency | Percent |
| Country | Level of education | ||||
| South Africa | 258 | 50.0 | Primary school completed |
17 (6a) (11b) |
3.3 (2.3a) (4.3b) |
| Thailand | 258 | 50.0 | Secondary school completed |
140 (66a) (74b) |
27.1 (25.6a) (28.7b) |
| Total | 516 | 100.0 | Tertiary education completed |
259 (106a) (153b) |
50.2 (41.1a) (59.3b) |
| Gender | Post graduate studies completed |
80 (60a) (20b) |
15.5 (23.3a) (7.8b) |
||
| Male |
273 (162a) (111b) |
52.9 (62.8a) (43.0b) |
Prefer not to answer | 20 (20a) | 3.9 (7.8a) |
| Female |
243 (96a) (147b) |
47.1 (37.2a) (57.0b) |
Total |
516 (258a,b) |
100.0 (100.0a,b) |
| Total |
516 (258a,b) |
100.0 (100.0a,b) |
Age | ||
| Years of possession of a driver’s license | 18-29 years |
336 (133a) (203b) |
65.1 (51.6a) (78.7b) |
||
| <10 years |
386 (173a) (213b) |
74.8 (67.1a) (82.6b) |
30-44 years |
109 (75a) (34b) |
21.1 (29.1a) (13.2b) |
| 10-20 years |
87 (56a) (31b) |
16.9 (21.7a) (12.0b) |
45-59 |
66 (46a) (20b) |
12.8 (17.8a) (7.8b) |
| >20 years |
43 (29a) (14b) |
8.3 (11.2a) (5.4b) |
60 years or older |
5 (4a) (1b) |
1.0 (1.6a) (.4b) |
| Total |
516 (258a,b) |
100.0 (100.0a,b) |
Total |
516 (258a,b) |
100.0 (100.0a,b) |
Note: aSouth Africa sample; bThailand sample
4. Analysis and Results
In line with the descriptive statistics in Table 2, this study found that the overall performances of the traffic police departments for all six dimensions were judged “unsatisfactory” (Tangible: M = 1.599/SD = .803; Reliability: M = 1.576/SD = .803; Promptitude: M = 1.603/SD = .775; Responsiveness: M = 1.568/SD = .779; Assurance: M = 1.642/SD = .784; Empathy: M = 1.593/SD = .754) by the respondents. Yet, in contrast, they reported being overall “satisfied” (M = 3.490/SD = .902) with the traffic police departments they are currently dealing with. The descriptive statistic results at country level followed the one displayed for the overall sample with the exception from South African drivers who expressed their satisfaction (M = 1.736/SD = .896) regarding the tangible dimension.
Table 2. Descriptive statistics
| Tangible | Reliability | Promptitude | Responsiveness | Assurance | Empathy | Level of satisfaction | ||
| N | Valid | 516 | 516 | 516 | 516 | 516 | 516 | 516 |
| Missing | 0 | 0 | 0 | 0 | 0 | 0 | 0 | |
| Mean |
1.5988 (1.7364a) (1.4612b) |
1.5756 (1.6008a) (1.5504b) |
1.6027 (1.6550a) (1.5504b) |
1.5678 (1.5814a) (1.5543b) |
1.6415 (1.6240a) (1.6589b) |
1.5930 (1.6047a) (1.5814b) |
3.4903 (3.4651a) (3.5155b) |
|
| Std. Deviation |
.80286 (.8955a) (.6722b) |
.80297 (.8755a) (.7217b) |
.77529 (.8695a) (.6656b) |
.77913 (.8571a) (.6939b) |
.78415 (.8565a) (.7057b) |
.75368 (.8268a) (.6741b) |
.90194 (1.0553a) (.7179b) | |
| Minimum | 1.00 | 1.00 | 1.00 | 1.00 | 1.00 | 1.00 | 1.00 | |
| Maximum | 3.00 | 3.00 | 3.00 | 3.00 | 3.00 | 3.00 | 5.00 | |
Note: aSouth Africa sample; bThailand sample
An investigation of correlational relationships indicated (Table 3) that age was positively and significantly correlated with driving experience at p ≤ .01 level (r = .80; p = .00; large effect size) and empathy at p ≤ .05 level (r = .14; p = .03; small effect size). These results mean that driving experience and perception on overall performance of empathy grow with age. By contrast, level of education was negatively and significantly correlated at p ≤ .05 level with reliability (r = -.13; p = .04; small effect size), promptitude (r = -.12; p = .04; small effect size) and empathy (r = -.14; p = .01; small effect size). It means that respondents’ perceptions of overall performance of traffic police departments’ service regarding reliability, promptitude and empathy decrease with a higher level of education. However, in-depth investigation at country level demonstrated, on one hand, “no” correlation between level of education and all variables from South African sample while age correlated positively and significantly with driving experience only at p ≤ .01 level (r = .63; p = .00; large effect size) as illustrated in Table 3a. On another hand, correlation statistics from the Thailand sample displayed in Table 3b highlighted that in addition to promptitude and empathy, level of education was negatively and significantly correlated at p ≤ .05 level with tangible (r = -.16; p = .01; small effect size) and age at p ≤ .01 (r = -.19; p = .01; small effect size) while “no” correlation was found with reliability like for the overall sample. Furthermore, results showed that age was positively and significantly correlated with tangible at p ≤ .05 level (r = .14; p = .02; small effect size).
Correlation results demonstrated that all dimensions and overall level of satisfaction were positively and significantly correlated with each other at p ≤ .01 level. Tangibility’s performance of traffic police departments’ service correlated with reliability (r = .67; p = .00; large effect size), promptitude (r = .56; p = .00; large effect size), responsiveness (r = .54; p = .00; large effect size), assurance (r = .54; p = .00; large effect size), empathy (r = .59; p = .00; large effect size) and overall level of satisfaction (r = .29; p = .00; small effect size). These results suggested that the higher the performance of traffic police departments’ service is perceived as tangible, the higher it is perceived as reliable, prompt, responsive, assured, empathic and satisfying. Reliability’s performance of traffic police departments’ service correlated with promptitude (r = .62; p = .00; large effect size), responsiveness (r = .54; p = .00; large effect size), assurance (r = .58; p = .00; large effect size), empathy (r = .63; p = .00; large effect size) and overall level of satisfaction (r = .25; p = .00; small effect size). It indicated that the higher the performance of traffic police departments’ service is perceived as reliable, the higher it is perceived as prompt, responsive, assured, empathic and satisfying.
Table 3. Pearson, Polyserial, and Polychoric Correlations (overall sample)
| 1 | 2 | 3 | 4 | 5 | 6 | 7 | 8 | 9 | 10 | 11 | ||
| Gender (1) | Correlation | 1 | -.109 | -.064 | -.051 | .023 | .113 | .026 | -.061 | .078 | .006 | .051 |
| Sig. | .141 | .440 | .312 | .785 | .121 | .773 | .310 | .255 | .990 | .289 | ||
| N | 516 | 516 | 516 | 516 | 516 | 516 | 516 | 516 | 516 | 516 | 516 | |
| Age (2) | Correlation | -.109 | 1 | .800** | -.020 | .092 | .029 | .064 | .045 | -.029 | .135* | .007 |
| Sig. | .141 | .000 | .717 | .172 | .628 | .301 | .424 | .540 | .034 | .537 | ||
| N | 516 | 516 | 516 | 516 | 516 | 516 | 516 | 516 | 516 | 516 | 516 | |
| Driving experience (3) | Correlation | -.064 | .800** | 1 | .000 | .029 | -.003 | -.030 | .006 | -.108 | -.076 | -.044 |
| Sig. | .440 | .000 | .960 | .765 | .960 | .569 | .803 | .088 | .239 | .216 | ||
| N | 516 | 516 | 516 | 516 | 516 | 516 | 516 | 516 | 516 | 516 | 516 | |
| Level of education (4) | Correlation | -.051 | -.020 | .000 | 1 | -.035 | -.129* | -.122* | -.090 | -.070 | -.144* | -.057 |
| Sig. | .312 | .717 | .960 | .674 | .037 | .040 | .172 | .225 | .012 | .306 | ||
| N | 516 | 516 | 516 | 516 | 516 | 516 | 516 | 516 | 516 | 516 | 516 | |
| Tangible (5) | Correlation | .023 | .092 | .029 | -.035 | 1 | .670** | .562** | .537** | .537** | .591** | .290** |
| Sig. | .785 | .172 | .765 | .674 | .000 | .000 | .000 | .000 | .000 | .000 | ||
| N | 516 | 516 | 516 | 516 | 516 | 516 | 516 | 516 | 516 | 516 | 516 | |
| Reliability (6) | Correlation | .113 | .029 | -.003 | -.129* | .670** | 1 | .621** | .542** | .579** | .625** | .250** |
| Sig. | .121 | .628 | .960 | .037 | .000 | .000 | .000 | .000 | .000 | .000 | ||
| N | 516 | 516 | 516 | 516 | 516 | 516 | 516 | 516 | 516 | 516 | 516 | |
| Promptitude (7) | Correlation | .026 | .064 | -.030 | -.122* | .562** | .621** | 1 | .699** | .667** | .649** | .259** |
| Sig. | .773 | .301 | .569 | .040 | .000 | .000 | .000 | .000 | .000 | .000 | ||
| N | 516 | 516 | 516 | 516 | 516 | 516 | 516 | 516 | 516 | 516 | 516 | |
| Responsiveness (8) | Correlation | -.061 | .045 | .006 | -.090 | .537** | .542** | .699** | 1 | .703** | .629** | .286** |
| Sig. | .310 | .424 | .803 | .172 | .000 | .000 | .000 | .000 | .000 | .000 | ||
| N | 516 | 516 | 516 | 516 | 516 | 516 | 516 | 516 | 516 | 516 | 516 | |
| Assurance (9) | Correlation | .078 | -.029 | -.108 | -.070 | .537** | .579** | .667** | .703** | 1. | .647** | .226** |
| Sig. | .255 | .540 | .088 | .225 | .000 | .000 | .000 | .000 | .000 | .000 | ||
| N | 516 | 516 | 516 | 516 | 516 | 516 | 516 | 516 | 516 | 516 | 516 | |
| Empathy (10) | Correlation | .006 | .135* | -.076 | -.144* | .591** | .625** | .649** | .629** | .647** | 1 | .226** |
| Sig. | .990 | .034 | .239 | .012 | .000 | .000 | .000 | .000 | .000 | .000 | ||
| N | 516 | 516 | 516 | 516 | 516 | 516 | 516 | 516 | 516 | 516 | 516 | |
| Level of satisfaction (11) | Correlation | .051 | .007 | -.044 | -.057 | .290** | .250** | .259** | .286** | .226** | .226** | 1 |
| Sig. | .289 | .537 | .216 | .306 | .000 | .000 | .000 | .000 | .000 | .000 | ||
| N | 516 | 516 | 516 | 516 | 516 | 516 | 516 | 516 | 516 | 516 | 516 | |
Note: **. Correlation is significant at the 0.01 level (2-tailed). *. Correlation is significant at the 0.05 level (2-tailed)
Table 3a. Pearson. Polyserial. and Polychoric Correlations (South Africa Sample)
| 1 | 2 | 3 | 4 | 5 | 6 | 7 | 8 | 9 | 10 | 11 | ||
| Gender (1) | Correlation | 1 | .043 | .007 | -.064 | -.006 | .085 | -.008 | -.083 | .020 | -.030 | .064 |
| Sig. | .488 | .914 | .304 | .920 | .172 | .896 | .186 | .754 | .636 | .309 | ||
| N | 258 | 258 | 258 | 258 | 258 | 258 | 258 | 258 | 258 | 258 | 258 | |
| Age (2) | Correlation | .043 | 1 | .631** | -.020 | -.058 | .035 | -.001 | .039 | -.054 | .079 | -.092 |
| Sig. | .488 | .000 | .748 | .356 | .574 | .982 | .537 | .387 | .203 | .142 | ||
| N | 258 | 258 | 258 | 258 | 258 | 258 | 258 | 258 | 258 | 258 | 258 | |
| Driving experience (3) | Correlation | .007 | .631** | 1 | -.041 | -.057 | .003 | -.037 | .038 | -.113 | -.095 | -.113 |
| Sig. | .914 | .000 | .512 | .366 | .958 | .555 | .546 | .070 | .127 | .071 | ||
| N | 258 | 258 | 258 | 258 | 258 | 258 | 258 | 258 | 258 | 258 | 258 | |
| Level of education (4) | Correlation | -.064 | -.020 | -.041 | 1 | -.008 | -.119 | -.101 | -.071 | -.027 | -.096 | -.033 |
| Sig. | .304 | .748 | .512 | .894 | .057 | .105 | .254 | .668 | .123 | .599 | ||
| N | 258 | 258 | 258 | 258 | 258 | 258 | 258 | 258 | 258 | 258 | 258 | |
| Tangible (5) | Correlation | -.006 | -.058 | -.057 | -.008 | 1 | .430** | .293** | .353** | .327** | .400** | .180** |
| Sig. | .920 | .356 | .366 | .894 | .000 | .000 | .000 | .000 | .000 | .004 | ||
| N | 258 | 258 | 258 | 258 | 258 | 258 | 258 | 258 | 258 | 258 | 258 | |
| Reliability (6) | Correlation | .085 | .035 | .003 | -.119 | .430** | 1 | .324** | .232** | .297** | .372** | .138* |
| Sig. | .172 | .574 | .958 | .057 | .000 | .000 | .000 | .000 | .000 | .026 | ||
| N | 258 | 258 | 258 | 258 | 258 | 258 | 258 | 258 | 258 | 258 | 258 | |
| Promptitude (7) | Correlation | -.008 | -.001 | -.037 | -.101 | .293** | .324** | 1 | .463** | .405** | .356** | .142* |
| Sig. | .896 | .982 | .555 | .105 | .000 | .000 | .000 | .000 | .000 | .023 | ||
| N | 258 | 258 | 258 | 258 | 258 | 258 | 258 | 258 | 258 | 258 | 258 | |
| Responsiveness (8) | Correlation | -.083 | .039 | .038 | -.071 | .353** | .232** | .463** | 1 | .421** | .364** | .203** |
| Sig. | 0.186 | 0.537 | 0.546 | 0.254 | 0.000 | 0.000 | 0.000 | 0.000 | 0.000 | 0.001 | ||
| N | 258 | 258 | 258 | 258 | 258 | 258 | 258 | 258 | 258 | 258 | 258 | |
| Assurance (9) | Correlation | .020 | -.054 | -0.113 | -.027 | .327** | .297** | .405** | .421** | 1 | .361** | .134* |
| Sig. | .754 | .387 | .070 | .668 | .000 | .000 | .000 | .000 | .000 | .031 | ||
| N | 258 | 258 | 258 | 258 | 258 | 258 | 258 | 258 | 258 | 258 | 258 | |
| Empathy (10) | Correlation | -.030 | .079 | -.095 | -.096 | .400** | .372** | .356** | .364** | .361** | 1 | .140* |
| Sig. | .636 | .203 | .127 | .123 | .000 | .000 | .000 | .000 | .000 | .024 | ||
| N | 258 | 258 | 258 | 258 | 258 | 258 | 258 | 258 | 258 | 258 | 258 | |
| Level of satisfaction (11) | Correlation | .064 | -.092 | -.113 | -.033 | .180** | .138* | .142* | .203** | .134* | .140* | 1 |
| Sig. | .309 | .142 | .071 | .599 | .004 | .026 | .023 | .001 | .031 | .024 | ||
| N | 258 | 258 | 258 | 258 | 258 | 258 | 258 | 258 | 258 | 258 | 258 | |
Note: **. Correlation is significant at the 0.01 level (2-tailed). *. Correlation is significant at the 0.05 level (2-tailed)
Table 3b. Pearson. Polyserial. and Polychoric Correlations (Thailand Sample)
| 1 | 2 | 3 | 4 | 5 | 6 | 7 | 8 | 9 | 10 | 11 | ||
| Gender (1) | Correlation | 1 | -.086 | -.009 | .085 | .119 | .066 | .072 | .006 | .079 | .041 | .013 |
| Sig. | .166 | .885 | .171 | .056 | .289 | .250 | .925 | .204 | .511 | .831 | ||
| N | 258 | 258 | 258 | 258 | 258 | 258 | 258 | 258 | 258 | 258 | 258 | |
| Age (2) | Correlation | -.086 | 1 | .658** | -.19** | .144* | -.021 | .081 | .021 | .029 | .113 | .116 |
| Sig. | .166 | .000 | .002 | .021 | .742 | .196 | .739 | .645 | .070 | .064 | ||
| N | 258 | 258 | 258 | 258 | 258 | 258 | 258 | 258 | 258 | 258 | 258 | |
| Driving experience (3) | Correlation | -.009 | .658** | 1 | -.028 | .052 | -.025 | -.038 | -.039 | -.009 | .008 | .067 |
| Sig. | .885 | .000 | .650 | .407 | .690 | .544 | .535 | .885 | .904 | .286 | ||
| N | 258 | 258 | 258 | 258 | 258 | 258 | 258 | 258 | 258 | 258 | 258 | |
| Level of education (4) | Correlation | .085 | -.189** | -.028 | 1 | -.155* | -.074 | -.124* | -.057 | -.090 | -.153* | -.055 |
| Sig. | .171 | .002 | .650 | .013 | .238 | .047 | .358 | .150 | .014 | .378 | ||
| N | 258 | 258 | 258 | 258 | 258 | 258 | 258 | 258 | 258 | 258 | 258 | |
| Tangible (5) | Correlation | .119 | .144* | .052 | -.155* | 1 | .598** | .578** | .443** | .497** | .514** | .271** |
| Sig. | .056 | .021 | .407 | .013 | .000 | .000 | .000 | .000 | .000 | .000 | ||
| N | 258 | 258 | 258 | 258 | 258 | 258 | 258 | 258 | 258 | 258 | 258 | |
| Reliability (6) | Correlation | .066 | -.021 | -.025 | -.074 | .598** | 1 | .639** | .577** | .592** | .595** | .254** |
| Sig. | .289 | .742 | .690 | .238 | .000 | .000 | .000 | .000 | .000 | .000 | ||
| N | 258 | 258 | 258 | 258 | 258 | 258 | 258 | 258 | 258 | 258 | 258 | |
| Promptitude (7) | Correlation | .072 | .081 | -.038 | -.124* | .578** | .639** | 1 | .634** | .675** | .689** | .267** |
| Sig. | .250 | .196 | .544 | .047 | .000 | .000 | .000 | .000 | .000 | .000 | ||
| N | 258 | 258 | 258 | 258 | 258 | 258 | 258 | 258 | 258 | 258 | 258 | |
| Responsiveness (8) | Correlation | .006 | .021 | -.039 | -.057 | .443** | .577** | .634** | 1 | .705** | .614** | .205** |
| Sig. | .925 | .739 | .535 | .358 | .000 | .000 | .000 | .000 | .000 | .001 | ||
| N | 258 | 258 | 258 | 258 | 258 | 258 | 258 | 258 | 258 | 258 | 258 | |
| Assurance (9) | Correlation | .079 | .029 | -.009 | -.090 | .497** | .592** | .675** | .705** | 1 | .672** | .241** |
| Sig. | .204 | .645 | .885 | .150 | .000 | .000 | .000 | .000 | .000 | .000 | ||
| N | 258 | 258 | 258 | 258 | 258 | 258 | 258 | 258 | 258 | 258 | 258 | |
| Empathy (10) | Correlation | .041 | .113 | .008 | -.153* | .514** | .595** | .689** | .614** | .672** | 1 | .206** |
| Sig. | .511 | .070 | .904 | .014 | .000 | .000 | .000 | .000 | .000 | .001 | ||
| N | 258 | 258 | 258 | 258 | 258 | 258 | 258 | 258 | 258 | 258 | 258 | |
| Level of satisfaction (11) | Correlation | .013 | .116 | .067 | -.055 | .271** | .254** | .267** | .205** | .241** | .206** | 1 |
| Sig. | .831 | .064 | .286 | .378 | .000 | .000 | .000 | .001 | .000 | .001 | ||
| N | 258 | 258 | 258 | 258 | 258 | 258 | 258 | 258 | 258 | 258 | 258 | |
Note: **. Correlation is significant at the 0.01 level (2-tailed). *. Correlation is significant at the 0.05 level (2-tailed)
Performance of traffic police departments’ service regarding promptitude correlated with responsiveness (r = .70; p = .00; large effect size), assurance (r = .67; p = .00; large effect size), empathy (r = .65; p = .00; large effect size) and overall level of satisfaction (r = .26; p = .00; small effect size). These results suggested that the higher the performance of traffic police departments’ service is perceived as prompt, the higher it is perceived as responsive, assured, empathic and satisfying. Responsiveness’ performance of traffic police departments’ service correlated with correlated with assurance (r = .70; p = .00; large effect size), empathy (r = .63; p = .00; large effect size) and overall level of satisfaction (r = .29; p = .00; small effect size). It indicated that the higher the performance of traffic police departments’ service is perceived as responsive, the higher it is perceived as assured, empathic and satisfying. Performance of traffic police departments’ service regarding assurance correlated with empathy (r = .65; p = .00; large effect size) and overall level of satisfaction (r = .23; p = .00; small effect size). These results suggested that the higher the performance of traffic police departments’ service is perceived as assured, the higher it is perceived as empathic and satisfying. Empathy’s performance of traffic police departments’ service correlated with overall level of satisfaction (r = .23; p = .00; small effect size). It indicated that the higher the performance of traffic police departments’ service is perceived as empathic, the higher it is perceived as satisfying. Correlation statistic results from South Africa and Thailand regarding all SERVQUAL dimensions corroborated the overall sample’s correlation statistics mentioned above.
The OLS regression results performed to test if age, gender, driving experience, level of education, and overall perceived performances of traffic police departments’ service regarding the six considered dimensions of tangibility, reliability, promptitude, responsiveness, assurance, and empathy, significantly predicted respondents’ overall level of satisfaction are shown in Table 4-6. The fitted regression model was: Level of satisfaction = 2.952 + 0.123*(tangible) + 0.124*(responsiveness). The overall regression was statistically significant (R2 = .070, F(10, 504) = 3.813, p ≤ .00). It was found that tangible (β = .123, p = .038) and responsiveness (β = .124, p = .047) significantly predicted level of satisfaction. It was found that gender (β = .076, p = .335), age (β = -.010, p = .001), driving experience (β = .067, p = .428), level of education (β = -.027, p = .571), and overall perceived performances of traffic police departments’ service regarding reliability (β = .054, p = .370), promptitude (β = .049, p = .459), assurance (β = .024, p = .709), and empathy (β = .076, p = .888) did not significantly predict level of satisfaction. By contrast, the OLS regression performed for the South African sample unveiled that only responsiveness (β = .194, p = .037) was a significant predictor of level of satisfaction. The fitted regression model was: Level of satisfaction = 2.916 + 0.194*(responsiveness). The overall regression for the South Africa sample was statistically significant (R2 = .077, F(10, 246) = 2.055, p ≤ .05). However, none of the variables considered in the model significantly predicted level of satisfaction for the Thailand sample although the overall regression was statistically significant (R2 = .107, F(10, 247) = 2.959, p ≤ .05).
Table 4. Models Summariesb
| Model | R | R Square | Adjusted R Square | Std. Error of the Estimate |
| OM | .265a | .070 | .052 | .87883 |
| SAM | .278a | .077 | .040 | 1.036 |
| THAM | .327a | .107 | .071 | .692 |
Note: a. Predictors: (Constant), Empathy, Gender, Driving experience, Level of education, Tangible, Responsiveness, Reliability, Assurance, Promptitude, Age. b. Dependent Variable: Level of satisfaction. OM = Overall Model; SAM = South Africa Model; THAM = Thailand Model
Table 5. ANOVAa
| Model | Sum of Squares | df | Mean Square | F | Sig. | |
| OM | Regression | 29.451 | 10 | 2.945 | 3.813 | .000b |
| Residual | 389.260 | 504 | .772 | |||
| Total | 418.711 | 514 | ||||
| SAM | Regression | 22.043 | 10 | 2.204 | 2.055 | .029b |
| Residual | 263.926 | 246 | 1.073 | |||
| Total | 285.969 | 256 | ||||
| THAM | Regression | 14.167 | 10 | 1.417 | 2.959 | .002b |
| Residual | 118.271 | 247 | .479 | |||
| Total | 132.438 | 257 | ||||
Note: a. Predictors: (Constant), Empathy, Gender, Driving experience, Level of education, Tangible, Responsiveness, Reliability, Assurance, Promptitude, Age. b. Dependent Variable: Level of satisfaction. OM = Overall Model; SAM = South Africa Model; THAM = Thailand Model
Table 6. Ordinary Least Square (OLS)- Coefficientsa
| OM | SAM | THAM | ||||
| B | Sig. | B | Sig. | B | Sig. | |
| (Constant) | 2.952 | .000 | 2.916 | .000 | 2.818 | .000 |
| Gender | .076 | .335 | .166 | .222 | -.019 | .832 |
| Age | -.010 | .889 | -.063 | .556 | .099 | .309 |
| Driving experience | -.067 | .428 | -.125 | .328 | .015 | .894 |
| Level of education | -.027 | .571 | -.012 | .863 | .002 | .976 |
| Tangible | .123 | .038 | .098 | .260 | .136 | .119 |
| Reliability | .054 | .370 | .055 | .524 | .094 | .293 |
| Promptitude | .049 | .459 | .022 | .803 | .119 | .267 |
| Responsiveness | .124 | .047 | .194 | .037 | -.003 | .976 |
| Assurance | .024 | .709 | -.004 | .966 | .087 | .384 |
| Empathy | .009 | .888 | .031 | .745 | -.060 | .549 |
Note: a. Dependent Variable: Level of satisfaction. OM = Overall Model; SAM = South Africa Model; THAM = Thailand Model
5. Conclusions, recommendations, and limitations
The major findings from this study are:
a) The overall performances of traffic police departments’ service with regard to all six dimensions considered are perceived “unsatisfactory” while, in contrast, respondents consider being satisfied overall. Thus, it was confirmed that respondents’ expectations surpassed their perceived performances regarding all six dimensions of service quality delivered by the traffic police departments.
b) Age correlated positively and significantly with empathy. This informed that police officers tend to give individualised attention, behave cordially, understand the specific needs, show commitment to solving problems presented, have best interest at heart and operate at convenient hours to elders when it comes to elderly people.
c) Level of education correlated negatively and significantly with reliability, promptitude and empathy. It reflected that respondents with a lower level of education find it difficult to understand the information and documentation provided by the traffic police departments. Also, police officers do not inform them about the progress of the process, demonstrate no concern for providing the best service, do not keep promises, do not show sincere interest to solve their problems, do not perform the service right the first time, do not keep accurate records. They do not believe that service delivery is fair to all.
- Likewise, lower educated respondents estimated that the traffic police departments’ service is slow, police officers are not fast at executing the work and do not inform them about what they are doing during the service. Pay and eye test and processing stations are not adequately staffed and ready to serve. Similarly, they believe that traffic police officers do not give individualised attention, do not behave cordially, do not understand their specific needs, do not show commitment to solve problems presented, do not have their best interest at heart and operate at inconvenient hours.
d) All dimensions and overall level of satisfaction were positively and significantly correlated with each other. Therefore, it was assumed that level of satisfaction increases when overall perceived performances of all six dimensions tend towards the “ideal.” These findings highlight, in line with studies conducted by Onyeaghala (2016), Zeithaml et al. (2006) and Gronroos (1984), that tangible, prompt, responsive, assured and emphatic service are helpful in achieving motorists’ satisfaction through providing quick, receptive, guaranteed, easy to access, secured and confidential service. Likewise, good communication, understanding the need, showing compassion and having sincere interest in giving individual attention to motorists enhance their level of satisfaction. Also, reliability helps to increase motorists’ level of satisfaction when traffic police officers keep promises and give the right service the first time.
e) Tangibility and responsiveness significantly predicted level of satisfaction. Thus, these two factors constitute the cornerstone of a strategy to level up motorists’ level of satisfaction by increasing the quality of service delivered by the traffic police departments in South Africa and Thailand;
f) Significant positive correlation observed between age and tangibility from the Thailand sample indicated that the younger the motorists are, the higher the performance of traffic police departments’ service is perceived as tangible. Also, the significantly negative correlation between level of education and tangibility meant that the performance of traffic police departments’ service regarding tangibility decrease with high level of education;
g) Responsiveness was the only predictor of level of satisfaction from the South African sample while none of the variables explained it from the Thailand one. However, this does not mean that they are useless as prior results demonstrated their correlational power. Thus, they are influencers of level of satisfaction.
5.1. Theoretical Contributions
Research investigating service quality are numerous but those focusing on Traffic Police Department are few. Hence this study’s findings enrich the field. Most importantly, this study is unique by applying the principles of the expectancy-disconfirmation model approach that led to the calculation of the difference between perceived performance and expectations within each dimension to constitute the overall performance of traffic police service quality for that dimension as expressed by the formula: OPi = ∑ PPi - ∑ EXPi.
5.2. Managerial Implications or Policy Implications
From the findings above, this study suggests that traffic police departments develop strategies to increase motorists’ perceived performance of its service. Traffic police officers should be trained, if needed, to show empathy to all age ranges and educational levels, promptly process traffic-related cases or files and provide reliable service specially for lower educated motorists. Furthermore, it becomes obvious that fully functional and high-quality traffic service alone cannot guarantee motorists’ satisfaction. Hence, this study recommends designing traffic service that consider SERVQUAL dimensions as crucial factors in the quest to increase motorists’ satisfaction.
5.3. Limitations of study / Future directions of research
This study, although providing useful and interesting results, had some limitations related to the theoretical model approach it adopted. Indeed, a study of this nature should not only rely on the expectancy confirmation/disconfirmation model. It is worth exploring what the other three models have to tell in term of statistical results to see if they remain consistent with one another or if there are divergences and what are they? From this comparison, what would the lessons to retain be and how do they impact former comparative studies scrutinising the four mentioned SERVQUAL models like those conducted by Johnson et al. (1996) and Mowen et al. (1995)? Lastly, consideration should be given to expanding the model by integrating behavioural and situational factors alongside expectations and perceived performance to get gain greater insight into the phenomenon.
---
Author Contributions: Lutete C. Ayikwa: Software, Data analysis and writing. Johan W. De Jager: Conceptualization, Methodology, data collection and Supervision. Edward M. Rankhumise: Validation visualization and Writing - Review and Editing. Pensri Jaroenwanit: Resources and data collection.
Funding:This research received no external funding.
Conflicts of Interest: The authors state that they have no conflicts of interest.
References
- Ayikwa, C., 2020. Les Fondamentaux du Marketing, 1st ed. Kinshasa, DR Congo: Soltech, pp. 1-25.
- Baker, M. J. and Saren, M., 2010. Marketing Theory, 2nd ed. Thousand Oaks (California), USA: Sage publications Ltd.
- Browne, M. and O'Donnabhain, S., 2000. The Assessment of Client Satisfaction in the Client- Project Manager Relationship: An Expectations - Artefact Model. Project Management, 5(1), pp. 42-49.
- Brysland, A. and Curry, A., 2001. Service improvements in public services using SERVQUAL. Managing Service Quality, 11(6), pp. 389-401. doi: https://doi.org/10.1108/09604520110410601
- Chatzoglou, P., Chatzoudes, D., Vraimaki, E. and Diamantidis, A., 2013. Service quality in the public sector: the case of the Citizen's Service Centers (CSCs) of Greece. International Journal of Productivity and Performance Management, 62(6), pp. 583-605. doi: https://doi.org/10.1108/IJPPM-12-2012-0140
- Cook, D. P., Goh, C. and Chung, C. H., 1999. Service typologies: A state of the art survey. Production and Operations Management, 8(3), pp. 318-338. doi: https://doi.org/10.1111/j.1937-5956.1999.tb00311.x
- Delcey, T. and Sergi, F., 2019. The Efficient Market Hypothesis and Rational Expectations. How Did They Meet and Live (Happily?) Ever After. [online] Available at: https://hal.archives-ouvertes.fr/hal-02187362 [Accessed on 7 May 2022].
- Gronroos, C., 1984. Service Quality Model and its Marketing Implications. European Journal of Marketing, 18(4), pp. 36-44. doi: https://doi.org/10.1108/EUM0000000004784
- Gunning, J. G., 2000. Models of customer satisfaction and service quality as research instruments in construction management. 16th Annual ARCOM Conference, 6-8 September 2000, Glasgow Caledonian University. Glasgow: Association of Researchers in Construction Management, pp. 21-30.
- Jewczyn, N., 2010. A comparison of equity theory and expectancy theory and some implications for managers in a global work environment. Journal of Business Management and Entrepreneurship, 1(8), pp. 1-11.
- Johnson, M. D., Nader, G. and Fornell, C., 1996. Expectations, perceived performance, and customer satisfaction for a complex service: The case of bank loans. Journal of Economic Psychology, 17, pp. 163-182. doi: https://doi.org/10.1016/0167-4870(96)00002-5
- Kurtz, D. L. and Clow, K. E., 2007. Service Marketing, 3rd ed. New York, USA: Wiley.
- Mason, R. B., Ngobese, N. and Maharaj, M., 2019. Perceptions of service provided by South African police service community service centres. Police Practice and Research, 22(1), pp. 1-18. doi: https://doi.org/10.1080/15614263.2019.1644176
- Mowen, J. C., Engel, J. F., Blackwell, R. D. and Mimiard, P. W., 1995. Consumer Behavior. Englewood Cliffs (New Jersey), USA: Prentice-Hall.
- Muth, J. F., 1961. Rational expectations and the theory of price movement. Econometrica, 29(3), pp. 315-335. doi: https://doi.org/10.2307/1909635
- Onyeaghala, O. H., 2016. Servqual Model as Performance Evaluation Instrument for Small and Medium Sized Enterprises (SME): Evidence From Customers in Nigeria. European Scientific Journal, 12(28), pp. 520-540. doi: https://doi.org/10.19044/esj.2016.v12n28p520
- Parasuraman, A., Zeithaml, V. A. and Berry, L. L., 1985. A conceptual model of service quality and its implications for future research. Journal of Marketing, 49(4), pp. 41-50. doi: https://doi.org/10.1177/002224298504900403
- Parasuraman, A., Zeithaml, V. A. and Berry, L. L., 1988. SERVQUAL: A multiple-item scale for measuring consumer perceptions of service quality. Journal of Retailing, 64(1), pp. 12-40.
- Pollanen, R. M., 2005. Performance measurement in municipalities: empirical evidence in Canadian context. International Journal of Public Sector Management, 18(1), pp. 4-24. doi: https://doi.org/10.1108/09513550510576125
- Qu, H. and Ping, E. W. Y., 1999. A service performance model of Hong Kong cruise travelers' motivation factors and satisfaction. Tourism Management, 20, pp. 237-244. doi: https://doi.org/10.1016/S0261-5177(98)00073-9
- Reisig, M. D. and Chandek, M. S., 2001. The effects of expectancy disconfirmation on outcome satisfaction in police-citizen encounters. International Journal of Police Strategies and Management, 24(1), pp. 88-99. doi: https://doi.org/10.1108/13639510110382278
- Rossi, F. M. and Aversano, N., 2015. Advancing performance measurement- Italian local government vis-à-vis the IPSASB project. International Journal of Productivity and Performance Management, 64(1), pp. 76-93. doi: https://doi.org/10.1108/IJPPM-07-2013-0134
- Sarrico, C. S., Ferreira, L. M. D. F. and Silva, L. F. C., 2013. POLQUAL – measuring service quality in police traffic services. International Journal of Quality and Service Sciences, 5(3), pp. 275-289. doi: https://doi.org/10.1108/IJQSS-12-2012-0024
- Setiadjit, D. G. and Utomo, A., 2016. A Servqual Measurement of Public Service from Motor VehicleTaxation Office (SAMSAT) In Indonesia. Industrial Engineering Letters, 6(8), pp. 76-82.
- Shah, A. and Regassa, H., 2010. Return on quality - quality’s impact on customer satisfaction, revenue growth, profitability and cost efficiency - a cross national comparative analysis of Japanese and American manufacturers in the auto industry. Marketing Management Journal, 20(2), pp. 163-179.
- Verma, R., 2001. Service marketing. In: Handbook of logistics and supply-chain management. Oxford, UK: Pergamon, pp. 271-292.
- Zeithaml, V. A., Bitner, M. J. and Gremler, D. D., 2006. Services Marketing: Integrating Customer Focus Across the Firm, 4th ed. Boston (MA), USA: McGraw-Hill/Irvin.
- Zhang, J., Chen, W., Petrovsky, N. and Walker, R. M., 2022. The Expectancy-Disconfirmation Model and Citizen Satisfaction with Public Services: A Meta-analysis and an Agenda for Best Practice. Public Administration Review, 82(1), pp. 147-159. doi: https://doi.org/10.1111/puar.13368
Article Rights and License
© 2023 The Authors. Published by Sprint Investify. ISSN 2359-7712. This article is licensed under a Creative Commons Attribution 4.0 International License.