Keywordsbrand equity brand loyalty CSR customer satisfaction quantitative method
JEL Classification I11, M30
Full Article
1. Introduction
Corporate Social Responsibility (CSR) is a multifaceted phenomenon that has long been embedded in business and societal discourse. Although often emphasised in the 21st-century business environment, the concept itself is not new and can be traced back to classical philosophers such as Plato. In today’s dynamic marketplace, consumers are increasingly aware of the products and services they purchase, often influenced by the social initiatives implemented by companies. Organisations that actively engage in social responsibility tend to attract and retain customers who value ethical conduct, while firms solely focused on profit maximisation are less appealing. Albus and Ro (2013: 8) stated that “customers have expected firms to act as good corporate citizens and not just to make a profit.” Similarly, Sharma and Jain (2019) argued that well-communicated CSR initiatives not only strengthen brand loyalty but also enhance overall brand equity.
Moreover, CSR can be defined as a “firm’s core strategy for voluntarily reflecting social and environmental concerns in the operation of the business to interact with various stakeholders” (Wang, Hsieh & Sarkis, 2018: 68). The concept has increasingly attracted scholarly attention, with research indicating that interest in CSR has “increased gradually owing to the growing, recent perception that sustainability is crucial for a firm’s long-term growth and survival” (Bahta, Yun, Islam & Bikanyi, 2021: 1429). Consequently, it is imperative for both scholars and managers to prioritise CSR initiatives, as they play a critical role in establishing and sustaining competitive advantage.
The structure of the current study is as follows: the introduction provides the background and context for the research. This is followed by a review of the relevant literature, including an analysis of prior studies related to the topic and the problem statement. The next section outlines the research methodology, after which the results are presented and discussed. Finally, the study concludes with recommendations, future research directions, and concluding remarks.
2. Literature Review
2.1. Corporate Social Responsibility Literature
In today’s competitive business environment, CSR is increasingly regarded as a strategic approach through which companies engage in initiatives that promote community well-being. Such initiatives encompass a wide range of activities, including cause promotion, societal marketing, corporate philanthropy, cause-related marketing, and community volunteering (Yoon, Kim & Lee, 2019). However, a notable research gap exists, as previous studies have not comprehensively examined the different elements of CSR, particularly within the South African context. This gap provides the motivation for the present study.
Furthermore, customers buy products or services to solve their problems. Since so many products are available, they choose a brand after careful evaluations of the attributes (Ramesh, Saha, Goswami, Sekar and Dahiya, 2018), favourable brand image (Shamma and Hassan, 2011), and favourable brand attitude (Ramesh et al., 2018); they also react to advertisements and other stimulating factors (Wu and Lin, 2014). When customers are aware of CSR activities, Ramesh et al. (2018) found that brand recognition increases, and the customer's attitude affects the purchase intention.
Firms increasingly integrate CSR programs into their business strategies to generate brand equity (Ramesh et al., 2018). CSRs have been everywhere across various businesses in diverse countries and industrial settings (Singh and del-Bosque, 2008). Previous studies by Ramesh et al. (2018:380) “have acknowledged CSR as a brand-building element in today's business settings and have determined that CSR leads to brand loyalty, positive brand relations, and perceived quality contributing holistically toward the growth of brand equity.”
With growing public demand for transparency in CSR initiatives, many companies committed to public welfare have aligned their business activities with broader societal objectives. As a result, CSR has evolved into a legal, legitimate, and strategically critical endeavour for business leaders (Ramesh et al., 2018). Consumers are more likely to remain loyal to brands that embody CSR-driven emotional values and are less inclined to switch to competitors (Lynch & de Chernatony, 2004). For example, when comparing two similar brands, customers may favour the one with a stronger societal reputation (Hea & Laib, 2014). Over time, CSR initiatives contribute to the development of favourable consumer attitudes and behaviours, enhanced purchase intentions, and even employment-seeking preferences. Moreover, CSR strengthens stakeholders’ advocacy behaviour, thereby reinforcing long-term brand equity (Du et al., 2010).
Saunders (2006) found that 52% of consumers are more likely to recommend a brand that supports a good cause over one that does not. Similarly, 55% of consumers indicated that during a recession, they would still purchase from brands engaged in socially responsible initiatives, even if those brands were not the most affordable. Companies that have integrated CSR as a core business strategy benefit from enhanced sustainability, reduced liabilities and insurance costs, and an improved brand image (Saunders, 2006). In the contemporary context, corporations increasingly recognise the link between CSR, reputation, and brand identity (Raman, Lim & Nair, 2012). Consumers’ perceptions of a company are generally shaped across two broad categories: brand performance and brand equity. Brand equity is defined as “a value premium that a company generates from a product with a recognizable name when compared to a generic equivalent” (Hayes, 2019: 1). Brand performance, by contrast, reflects “how well the product or service meets customers’ more functional needs” (Keller, 2019: 111). Raman, Lim, and Nair (2012) further emphasise that brand performance is associated with tangible and measurable outcomes that contribute to a company’s overall economic value.
Moreover, retail stores operating in emerging economies need to be cognisant of the socio-economic challenges affecting the communities in which they operate, such as inadequate access to sanitation, poverty, hunger, and financial barriers to secondary and higher education. Companies are expected to address these issues by implementing CSR initiatives. The presence of such socio-economic challenges underscores the strategic importance of CSR as a tool for improving community well-being and enhancing the lives of local populations.
The literature increasingly recognises CSR as a valuable mechanism for addressing socio-economic issues in emerging economies. Hohnen and Potts (2007: 57) highlight that strategic CSR encompasses managing environmental concerns, engaging stakeholders, ensuring fair working conditions, promoting eco-efficiency, fostering positive employee-community relations, advancing social equity, eliminating gender gaps, upholding human rights, implementing respectable governance, and combating corruption. By executing CSR programs, firms can enhance their goodwill and reputation within the community (Hohnen & Potts, 2007). For instance, companies investing in environmentally focused CSR initiatives ensure that their operations minimise environmental harm and may adopt renewable energy practices. Guha and Mandal (2019: 2) emphasise that one of the primary benefits of CSR is the strengthening of relationships between companies and the communities they serve.
For example, Woolworths, a retail store operating in an emerging economy, actively implements CSR policies. According to the Woolworths Report (2016: 38), “the company designs and implements certain strategies to enable their company to run better and benefit the surrounding environment. Woolworths has a good ethics and morals-based system, where their employees obey the company’s values.” The company addresses social challenges through initiatives such as developing schools as hubs of community engagement and contributing to education by collaborating with the National Collaboration Trust and implementing Woolworths Educational Programs (Woolworths Report, 2016).
These CSR initiatives not only benefit the community but also strengthen Woolworths’ brand image and reputation. By demonstrating a commitment to societal development and ethical business practices, the company fosters trust and loyalty among consumers. Positive community engagement enhances customer perceptions, increasing their likelihood of supporting Woolworths over competitors. Furthermore, CSR contributes to the long-term sustainability of the company by aligning business operations with societal and environmental needs, creating a competitive advantage while reinforcing stakeholder advocacy and brand equity.
2.2.Brand Equity
The term brand equity has been researched in numerous studies, and there have been plenty of perspectives in viewing what the term means (Farquhar, 2017). It is frequently defined as the value the brand name adds to a product. Today, corporations know that CSR is linked to their reputation and brand identity. Raman, Lim, and Nair (2012) stated that customer loyalty is related to brand equity. This means a possible relationship exists between CSR and loyalty through brand equity. CSR efforts by a company can enhance its brand equity and, thus, overall consumer loyalty (Raman, Lim, and Nair, 2012).
Smith, Gradojevic, and Irwin (2011) asserted that developing brand equity is one of the most significant marketing strategies undertaken by private companies. Similarly, Raman, Lim, and Nair (2012) argued that companies are often distinguished by their brand and are evaluated based on their performance in the eyes of society. This is further reinforced by the increasing role of technology and web-based intelligent sources, which enable consumers to verify information about a company’s social responsibility initiatives (Smith, Gradojevic & Irwin, 2011: 45).
Other researchers, such as Balsara (2009), have argued that CSR should be an integral component of a company’s overall brand strategy. They further suggested that CSR can not only promote social causes but also contribute to the development of distinctive brand equity. According to Raman, Lim, and Nair (2012: 77), “customers affiliate themselves with a particular brand based on the value of its brand.” Through this strong association, companies can establish a unique identification between the customer and the brand. This discussion indicates a potential relationship between consumer loyalty, brand equity, and CSR initiatives.
In addition, brand equity is commonly understood to comprise brand awareness, brand image, perceived quality, and brand loyalty. Brand awareness refers to the extent to which a brand is recognized and remembered by consumers. Brand image represents the distinctive perceptions that differentiate a firm from its competitors. Dong, Chang, and Wang (2016: 223) argued that “a favourable brand image encourages customers to maintain cognitive consistency and avoid discrepancies.” Perceived quality reflects consumers’ evaluation of the overall excellence or superiority of a product or service. Zeithaml (1996: 67) noted that “perceived quality relies on customers’ subjective evaluations of quality and is defined as a customer’s assessment of overall excellence or superiority of a product or service.” Finally, brand loyalty refers to a consumer’s commitment to repeatedly purchase from a specific company rather than its competitors. Hu, Kandampully, and Juwaheer (2009) emphasised that brand loyalty is a key driver of sustained consumer preference, while Schmidt (2019: 7) asserted that “brand loyalty is the core element of brand equity and is the customer’s attachment to a brand.”
3. Problem Statement and Research Objectives
While companies often invest in CSR activities partly to build goodwill, it remains unclear whether such initiatives directly contribute to brand equity. CSR can help address this uncertainty, as businesses operate within and interact closely with the communities they serve. Companies are integral members of these communities and have an obligation to fulfil social responsibilities. Social responsibility encompasses duties toward both the planet and the people inside and outside the organisation. Businesses maintain multiple social contacts, including owners, employees, customers, and suppliers. In the current context, society and the media increasingly expect companies to act responsibly and address environmental and social challenges (Clementino & Perkins, 2020).
Research Objectives:
To determine the impact of CSR on brand equity.
To assess consumer perceptions towards CSR.
Research Questions:
What is the impact of CSR on brand equity?
What are consumer perceptions towards CSR?
4. Research Methodology
There are two types of research methods, and these are qualitative and quantitative research methods. The current study adopted a quantitative research method. Quantitative research was used to quantify the problem by generating numerical data that was transformed into usable statistics. It is used to quantify attitudes, opinions, behaviours, and other defined variables–and generalize results from a larger sample population (DeFranzo, 2018). Quantitative research gathers information from existing and potential customers using sampling methods.
4.1. Sampling
Sampling means selecting a given number of subjects from a defined population to represent that population (Pandey and Pandey, 2015). A researcher cannot conduct research taking the whole population. A small group was selected to be the representative of the population. The current study chose a non-probability sampling method and used a convenience technique. This technique allowed the researcher to draw respondents who were available to participate in the study. Jha (2018:5) argued that “in this technique, the researcher selects the closest live persons as respondents. Subjects readily accessible or available to the researcher will be recruited to participate in the study.” In other words, the researcher chose respondents-customers who usually shop at selected Woolworth stores in Pietermaritzburg. To put it in another way, this technique permitted the researcher to select respondents who were at the store at the time of data collection and who qualified and were interested in being part of the sample. The researcher met participants at the selected stores and requested them to fill in survey questionnaires. This study specifically targeted customers who usually shop at Woolworths in Pietermaritzburg.
4.2 Data Collection Instrument
Every study requires data collection, which involves using tools or techniques to gather information. These tools can vary in complexity, interpretation, design, and administration (Pandey & Pandey, 2015). For this study, a survey questionnaire was the most suitable instrument, defined as “a systematic compilation of questions that are submitted to a sampling of the population from which information is desired” (Pandey & Pandey, 2015:57). More specifically, a questionnaire is “a device for securing answers to questions by using a form which the respondent fills in himself” (Pandey & Pandey, 2015:57). The questionnaire was designed to capture respondents’ perceptions of Corporate Social Responsibility (CSR) and brand equity. Regarding CSR, participants were asked about their awareness of CSR activities, their preference for companies involved in CSR, and their willingness to switch brands based on CSR initiatives. Items also addressed the company’s ethical behavior, compliance with legal norms, contributions to community welfare, sponsorship of social events, and efforts to achieve long-term success through CSR. For brand equity, respondents were asked about their loyalty to the company, brand recognition, and preference compared to competing brands. Items measured perceived quality, functionality, recall of brand characteristics and logos, and purchase intentions, even when alternative brands offered similar features. By consolidating the 20 items into these thematic paragraphs, the questionnaire provided a structured approach to measure participants’ perceptions of CSR and brand equity, enabling systematic quantitative analysis.
4.3 Questionnaire
The researcher used a survey questionnaire as a research instrument. Using the questionnaire allowed the researcher to collect a high proportion of usable answers from a sample size. There are three procedures for eliciting opinions and beliefs that have been used extensively in research: (i) the Thurston Technique, (ii) the Likert Method, and (iii) the Semantic Differential (Benson, 2010). To fulfill the objectives of the current study, the questionnaire included the Likert Scale Method. This method was of a more appropriate level for the scope of the present study. The questionnaire consisted of twenty-six (26) closed-ended questions and one (1) open-ended question. This enabled the researcher to gather factual information and gave insight into the respondents’ frame of reference and their reasons for their responses. In the open-ended question, the respondents were required to respond in writing, whereas closed-ended questions had options that were determined by the researcher (Burns and Grove, 2011). An open-ended question was included because it allowed respondents to respond to the question in their own words and provided more detail. Closed-ended questions were included because they were appropriate for the current study and better to administer and analyse (Burns and Grove, 2011).
4.4 Data Collection Procedure
Data were collected from three Woolworths retail stores in an emerging economy: Woolworths Boshoff Street in Pietermaritzburg Central Business District (CBD), Woolworths Scottsville, and Woolworths Liberty Mall. Permission and approval to conduct the study were obtained from the organisation prior to data collection. Woolworths Liberty Mall, being the largest branch, contributed 60 participants during the last week of January 2020. In addition, 40 participants were selected from the medium-sized Boshoff Street branch, and 20 participants were recruited from the smaller Scottsville branch, resulting in a total sample size of 120. Data collection occurred between November 2019 and January 2020. Participants were recruited from both the town (CBD) and urban store locations to ensure a representative sample of Woolworths shoppers.
A non-probability convenience sampling method was employed to select participants who were readily accessible and met the inclusion criteria. This method was appropriate given the study’s exploratory nature and the focus on regular customers who had experience with Woolworths’ CSR initiatives. The sample size of 120 was deemed sufficient to provide meaningful insights while remaining manageable for in-store data collection.
Participants were requested to complete the questionnaires in-store, which took approximately 10 minutes. The questionnaires were manually distributed by the researcher and research assistants to regular Woolworths shoppers. Customers who met the inclusion criteria and were willing to participate were provided with detailed information about the study before completing the questionnaire.
4.5 Data Analysis
Data analysis encompasses a wide range of quantitative activities. “It is a usual tendency in behavioural research that much use of quantitative analysis is made, and statistical methods and techniques are employed” (Pandey & Pandey, 2015: 70). Moreover, Hejase, Hayek, Qadri, and Haik (2012) emphasised that informed and objective decisions are based on facts and numerical evidence, relying on accurate, realistic, and timely information. According to Hejase et al. (2012: 3624), “descriptive statistics deals with describing a collection of data by condensing the amounts of data into simple representative numerical quantities or plots that can provide a better understanding of the collected data.”
In the current study, both descriptive and inferential statistical techniques were employed. These tools were instrumental in summarising the data and predicting relationships among the variables under investigation. Specifically, the purpose of data analysis in this study was to generate empirical insights into the relationship between CSR initiatives and brand equity, providing evidence to address the research objectives and questions.
4.5.1 Descriptive Statistics Analysis
Descriptive statistics enabled the researcher to organise and summarise the data in a meaningful way that allowed for straightforward interpretation. “Descriptive statistics include specific numbers and ways of presenting data in tabular form to make the information succinct but clear to the reader" (Cohen, Manion, and Morrison, 2011:622). Cohen et al. (2011) further stated that the most prevalent apparatuses of descriptive statistics include frequency distributions, along with measures of central tendency and variability. Frequency distributions are defined as visually depicted summaries of how frequently different scores occur within a sample of scores (Cohen et al., 2011). They help to show the number of times each response has been selected in each category. For example, on a question on gender, frequency distributions revealed how many or what percentage of the respondents were males and how many were females. A measure of central tendency is a single value that describes a data set by identifying the central position within that data. Measures of central tendency were used to represent a group of scores. The actions of central tendency that were calculated in this study were the mean, the median, and the mode.
4.5.2 Inferential Statistics Analysis
Inferential statistics allow the researcher to generalise the population with data gathered from a representative sample (Bhandari, 2020). Cohen et al. (2011:625) suggested: “that inferential statistics should allow researchers to draw inferences from a sample that can be applied or generalized to the population from which the sample came.” During quantitative research, it is paramount for the researcher to determine the relationships between variables and groups in a data set (Cohen 2011). The current study used t-tests, correlations, chi-square tests, and Cronbach coefficient alpha to interpret data.
5. Presentation of Results
5.1 Response Rate
The response rate is defined as the ratio of the number of usable questionnaires to the total respondents in the sample (Fincham, 2008). The researcher personally distributed 120 questionnaires, of which 117 were returned complete and usable, yielding a response rate of 97.5%. This high response rate can be attributed to the simplicity and brevity of the questionnaire, which was structured clearly and easily for respondents to complete, as well as the method of administration, where respondents were personally given the questionnaires and instructed to return them upon completion. Three questionnaires (2.5%) were discarded due to inaccuracies.
Table 1 summarises the distribution and return of the questionnaires across the selected Woolworths stores. Of the 120 questionnaires distributed, 117 were returned completed and usable, representing a 97.5% response rate, which was considered adequate for this study’s validation and analyses. The small proportion of non-responses (2.5%) reflected minimal non-cooperation. The high response rate was largely due to the personal administration of the questionnaires, and it indicates that the data collected were reliable and sufficient for the study’s objectives. The response rate (RR) was calculated using the formula:
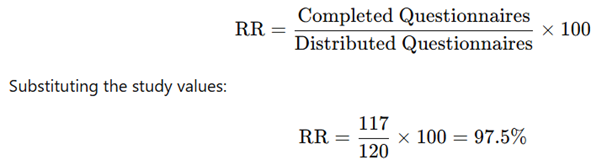
This indicates that 117 out of 120 distributed questionnaires were completed, resulting in a high response rate of 97.5%, which suggests strong participant engagement and reliable data collection.
Table 1: Response rate
| Organisation(Woolworths) | Questionnaires distributed | Questionnaires completed | Response rate(%) |
| Woolworths at Boshoff Street | 40 | 38 | 96 |
| Woolworths at Sidewalk Centre | 40 | 39 | 98 |
| Woolworths at Liberty Mall | 40 | 40 | 100 |
| Aggregate | 120 | 117 | 97,5 |
5.2 Demographic Profile
Demographics is defined as statistical data about the characteristics of a population, such as the age, gender, and income of the people within the population (Salkind 2010). Table 2 provides data regarding research participants and is necessary for determining whether the individuals in a particular study were a representative sample of the target population for generalization purposes. Moreover, Table 2 revealed a summarised demographic profile (age, gender, occupation, and income levels) of the sample categorised by gender as it was one of the critical variables.
Table 2: Sample Demographics by gender
| Male n=48 | Female n=69 | ||||
| Demographic variables | Category | Frequency | Percentage (%) | Frequency | Percentage (%) |
| Age | 20 – 30 | 11 | 8.9 % | 9 | 6.9 % |
| 31 – 40 | 19 | 15.3 % | 21 | 16.9 % | |
| 41 – 50 | 14 | 10.9 % | 29 | 22.2 % | |
| 51 > | 4 | 3.0 % | 10 | 7.6 % | |
| Occupation | Student | 3 | 2.4 % | 8 | 6.1 % |
| Self-employed | 8 | 6.5 % | 4 | 3.0 % | |
| Government servant | 20 | 16.2 % | 33 | 26.6 % | |
| Employer | 9 | 7.1 % | 21 | 16.8 % | |
| Other | 5 | 3.8 % | 3 | 2.3 % | |
| Income | $57.58 to $575.81 USD | 2 | 1.5 % | 4 | 3.0 % |
| $633.60 to $1,152.00 USD | 8 | 6.6 % | 8 | 6.2 % | |
| $1,209.60 to $1,785.60 USD | 12 | 10.0 % | 12 | 9.1 % | |
| $1,785.60 to $2,361.60 USD. | 13 | 10.5 % | 22 | 17.7 % | |
| $2,361.60 to $2,880.00 USD | 23 | 18.3 % | 13 | 10.5 % | |
| $2,880 USD and higher | 14 | 11.2 % | 10 | 7.6 % | |
5.3 Error checking for categorical variables
Table 3 revealed no errors in the data capture for the age, gender, and occupation variables. There were no missing cases in any of the variables, and all the cases were valid. The maximum and minimum values were correct and appropriate for all the variables when checked against the codebook.
Table 3: Error checking for categorical variables Statistics
| Age | Gender | Occupation | |
| N Valid | 117 | 117 | 117 |
| Missing | 0 | 0 | 0 |
| Minimum | 1 | 1 | 1 |
| Maximum | 3 | 2 | 4 |
5.4 Descriptive statistics analysis
Table 4 presents respondents’ perceptions of Corporate Social Responsibility (CSR) and its contribution to societal well-being. The statement presented to participants was: “This company is concerned with improving the general well-being of society.” The results indicate that 92.5% of respondents agreed that CSR activities bring well-being to society, with 69.9% strongly agreeing and 22.6% agreeing. Only 1.5% of respondents disagreed with the concept of CSR, where a company manages its social activities for the benefit of society. Those who disagreed may not perceive the CSR activities initiated by Woolworths or other companies in their community or may view CSR as a diversion of company profits. Overall, the high agreement suggests that Woolworths is perceived as highly responsible towards the communities it serves, which may enhance brand recall and loyalty among consumers.
Table 4: CSR and well-being
| Frequency | Percent (%) | Valid Percent (%) | Cumulative Percent (%) | |
| Valid Strongly agree – This company is concerned with improving the general well-being of society. | 100 | 92.5 | 92.5 | 92.5 |
| Agree – This company is concerned with improving the general well-being of society. | 10 | 22.6 | 22.6 | 98.6 |
| Somewhat agree – This company is concerned with improving the general well-being of society. | 4 | 3.5 | 3.5 | 88.7 |
| Neutral – This company is concerned with improving the general well-being of society. | 0 | 0 | 0 | 0 |
| Somewhat disagree – This company is concerned with improving the general well-being of society. | 2 | 2.5 | 2.5 | 83.9 |
| Disagree – This company is concerned with improving the general well-being of society. | 1 | 1.5 | 1.5 | 1.5 |
| Strongly disagree – This company is concerned with improving the general well-being of society. | 0 | 0 | 0 | 0 |
| Total | 117 | 100.0 | 100.0 |
Table 5 showed respondents’ preference for companies involved in CSR activities. When asked whether they would prefer a company brand that engaged in CSR, 40% of respondents (22% strongly agreed and 18% agreed) indicated that they would purchase products from a company that looked after the community it served. This suggested that less than half of the respondents actively supported companies based on CSR involvement. In contrast, 16.5% of respondents remained neutral, while 6% disagreed and 9% strongly disagreed with the idea of supporting CSR initiatives. Overall, a total of 15% of respondents indicated that they did not wish to support an organisation involved in CSR activities.
Table 5: Would prefer a company brand that is involved in CSR activities
| Frequency | Percent (%) | Valid Percent (%) | Cumulative Percent (%) | |
| Valid Strongly agree – I would prefer a company brand that is involved in CSR activities. | 25 | 22 | 22 | 30.5 |
| Agree – I would prefer a company brand that is involved in CSR activities. | 12 | 18 | 18 | 69.9 |
| Somewhat agree – I would prefer a company brand that is involved in CSR activities. | 23 | 19.49 | 19.49 | 78.9 |
| Neutral – I would prefer a company brand that is involved in CSR activities. | 19 | 16.51 | 16.51 | 89.0 |
| Somewhat disagree – I would prefer a company brand that is involved in CSR activities. | 14 | 13.14 | 13.14 | 92.0 |
| Disagree – I would prefer a company brand that is involved in CSR activities. | 6 | 2.49 | 2.49 | 98 |
| Strongly disagree – I would prefer a company brand that is involved in CSR activities. | 9 | 8.37 | 8.37 | 94 |
| Total | 117 | 100.0 | 100.0 |
The results in Table 6 revealed that 38% of respondents (19.8% strongly agreed and 18.2% agreed) and 20.6% somewhat agreed that they were loyal to the company, indicating that a total of 58.6% of respondents affirmed their loyalty. Customer loyalty reflects the extent to which customers are devoted to a company’s products or services and the degree to which they prefer one brand over competitors. The findings showed that just over half of the respondents reported being loyal to the company. Additionally, 17% of respondents were neutral and unsure about their loyalty, 5.2% disagreed, and 14% strongly disagreed. During discussions, some respondents indicated that they would still purchase a competing brand if Woolworths products were unavailable, out of stock, or lacked the required size.
Table 6: Customer loyalty
| Frequency | Percent (%) | V. Percent (%) | Cumulative Percent (%) | |
| Valid Strongly agree – I am loyal to the company. | 25 | 19.8 | 19.8 | 19.8 |
| Agree – I am loyal to the company. | 12 | 18.2 | 18.2 | 83.1 |
| Somewhat agree – I am loyal to the company. | 23 | 20.62 | 20.62 | 92.3 |
| Neutral – I am loyal to the company. | 19 | 17 | 17 | 86.3 |
| Somewhat disagree – I am loyal to the company. | 14 | 5.19 | 5.19 | 95.8 |
| Disagree – I am loyal to the company. | 6 | 14 | 14 | 89.4 |
| Strongly disagree – I am loyal to the company. | 9 | 5.19 | 5.19 | 98.22 |
| Total | 117 | 100.0 | 100.0 |
6. Inferential Statistics Analysis
6.1 Reliability Analysis: Cronbach Alpha Test
Cronbach’s coefficient alpha was used to measure the internal consistency or reliability of the data collection instrument. Reliability refers to how well a test measure what it should. This method was selected because it does not require the questionnaire to be administered twice to test for reliability. The results in Table 7 revealed a case processing summary that cases were excluded in the Cronbach coefficient alpha reliability test calculation. Only three of the respondents had invalid responses.
Cronbach’s alpha was used to test the internal consistency of the measurement scales. Since the questionnaire consisted of multiple constructs, reliability was assessed separately for each latent variable rather than for all items combined. The results showed that the CSR construct (α = 0.872), brand loyalty (α = 0.841), brand awareness (α = 0.857), and brand quality (α = 0.889) all exceeded the minimum threshold of 0.70, which indicates satisfactory reliability. These values suggest that the items within each construct consistently measured the same underlying concept, thus confirming the reliability of the scales used in this study (Nunnally, 1978; Hair et al., 2020).
Table 8: Cronbach’s Alpha Coefficient Reliability Statistics
| Construct / Latent Variable | Number of Items | Cronbach’s Alpha |
| Corporate Social Responsibility (CSR) | 11 | 0.872 |
| Brand Loyalty | 4 | 0.841 |
| Brand Awareness / Recognition | 5 | 0.857 |
| Brand Quality / Functionality | 6 | 0.889 |
Notes:Cronbach’s alpha was computed separately for each latent variable to measure internal consistency.Values above 0.7 indicate acceptable reliability, showing that the items within each construct consistently measure the same underlying concept.
Statistics in Table 9 revealed a p-value of .462, which is above 0.05. This result suggested that there is no statistically significant relationship between these variables. This exposed the fact that there are no gender differences in the perception of the product functionality.
Table 9: Chi-square Test, Gender versus Product functionality
| Value | Df | Asymp. Sig. (2sided) | |
| Pearson Chi-square | 1.5439a | 2 | .462 |
| Likelihood Ratio | 1.609 | 2 | .447 |
| Linear-by-linear Association | 1.476 | 1 | .224 |
| N of Valid Cases | 117 |
The Chi-square test of independence was conducted to examine whether there was a significant association between gender and perceptions of product functionality. The null hypothesis (H₀) stated that there was no significant relationship between gender and product functionality, while the alternative hypothesis (H₁) stated that there was a significant relationship between the two variables. The Pearson Chi-square value was 1.539 with 2 degrees of freedom and a p-value of 0.462. Since the p-value was greater than the significance threshold of 0.05, the null hypothesis was not rejected. This indicated that gender did not have a statistically significant effect on perceptions of product functionality. In other words, male and female respondents shared similar views regarding how functional the product was. This finding suggested that perceptions of product functionality were independent of gender differences within the sample.
6.2 Correlation
A correlation is defined as the relationship between two variables. It is a statistical technique that shows whether and how strongly pairs of variables are related (Salkind, 2010). In this study, correlation analysis was conducted to examine the association between perceptions of Woolworths’ CSR initiatives and consumer evaluations of the company’s reputation.
As presented in Table 10, the analysis revealed a correlation coefficient of r = .889 with a p-value of .005. Since the p-value was below the 0.05 threshold, the relationship was statistically significant. The positive correlation coefficient indicated a very strong, direct relationship between the two variables. This finding suggested that as consumers’ awareness and perceptions of Woolworths’ CSR initiatives increased, their perceptions of the company’s reputation and social orientation also improved.
These results implied that consumers viewed Woolworths not only as a retailer but also as an organisation committed to sustainability and socially responsible practices. In turn, this CSR engagement appeared to enhance the company’s progressive reputation, reinforcing the perception that Woolworths was socially oriented and community-focused. Such findings are consistent with prior research highlighting CSR as a strategic driver of both brand image and brand equity.
Table 10: Correlation between CSR and brand equity
| CSR | Brand Equity | |
| CSR | 1 | 0.89** |
| Brand Equity | 0.89** | 1 |
| Sig. (2-tailed) | – | 0.005 |
| N | 117 | 117 |
Note: **. Correlation is significant at the 0.01 level (2-tailed)
7. Discussion
7.1 Objectives
The statistics of the current study revealed that females (69%) participated more than males. The researcher observed that females are the ones who usually do shopping at Woolworths. Therefore, that is why the percentage of female participants is much higher than that of male participants. The two sexes differ in their perspectives, motives, rationales, and actions about shopping (Hejase et al., 2016). When a researcher had a dialogue with the female respondents, they revealed that as women, they shop more than men because they enjoy shopping more than males do. This gender indicated that they find shopping therapeutic. Brennan (2013:11) argued that “in virtually every society in the world, women have primary caregiving responsibilities for both children and the elderly (and often, just about everybody else in-between).” Therefore, a woman in this primary caregiving role, find themselves buying on behalf of everyone else in their lives.
Objective 1: To determine the effects of CSR on brand equity.
The results of this study revealed that when respondents were asked if they would prefer a company brand that is involved in CSR activities, an overall 40% of the respondents strongly agreed that they would buy products from a company that looks after the community it serves. 40% of the respondents believed in supporting an organisation that is socially responsible, and that is involved in CSR activities. For example, CSR actions are an impactful and innovative way for companies to establish a reputation as a socially responsible companies and impact the company’s brand reputation. Not to mention it is an easy way to retain top employees. When the researcher examined the past related literature on objective 1, the researcher found out that in the past, there were numerous ways in which CSR was used to build brand equity, ultimately affecting the brand image of the company positively. Rese (2006), in their literature, discovered that in a highly competitive market, developing a strong brand is an important factor in the success of firms. Brand equity is essential to building brand value and raising a firm’s competitiveness in the market (Delgado‐Ballester and Munuera‐Aleman, 2005).
Objective 2: To determine consumer perceptions towards CSR.
The findings of this study revealed that in reply to a question about awareness of CSR activities done by Woolworths, a total of 45% of the respondents strongly agreed with the statement. This result revealed that 45% of customers' perceptions of CSR cultivated brand equity. This result suggested that some consumers are pretty aware of CSR activities done by this company. Furthermore, this result indicated that some consumers are environmentally conscious. Environmental-conscious consumers are customers willing to buy goods or services or even pay an extra amount for eco-friendly products. In his study, Young (2019:10) contends that “millennials (aged 22-35) are more likely than any other generation to say that they would pay extra for eco-friendly or sustainable products.” Consumers in small or big markets are increasingly motivated to be more environmentally conscious and exercise their power and voice through the products they buy.
Perception is everything in today’s volatile and ever-changing business environment. It is tough to change if customers have poor or negative feelings about a company’s brand, without a real focus. Consumer perception explains consumer behaviour by analysing motivations for buying - or not buying - particular items (Kotler and Lee, 2004). Kotler and Lee (2004:84) reached a conclusion that “consumer perception relates to self-perception, price perception and perception of a benefit to the quality of life.” Customer perception is, for example, affected by advertising, reviews, public relations, social media, personal experiences, and other channels. Therefore, the researcher suggested a positive perception of consumers toward CSR. First, some consumers are aware of and interested in CSR and consider CSR as a purchase criterion. Other consumers are willing to pay a higher price for that firm’s products (Handelman and Arnold 1999).
7.2 Recommendations
Educating customers about CSR
Customers need to be educated by companies about CSR initiatives and CSR importance. In marketing or any industry educating a customer is an important part that has no current equivalent in the market. McGregor (2014) stated that teaching customers about CSR ensures that they understand the benefits and value of the CSR program. It must be based on an understanding of customers' real needs. A clear awareness of what the concept of CSR entails will reduce the chances of consumers being confused and thus having a bad impression of the company. An appropriate CSR reporting strategy should be employed such that the communication of CSR initiatives can be done in an appropriate way. Dapi and Phiri (2015) commented that some companies have reported their CSR activities in ways that have been considered by consumers to be advertising.
Increased consumer engagement
Customer engagement is considered to be an important customer relationship management construct by service researchers (Iriqat and Daqar, 2017). Understanding customer preferences is particularly paramount to getting customers to engage in CSR activities. This is because it is important for organisations to choose societal initiatives that are of interest to their customers, and address their concerns, to get them engaged in corporate social responsibility strategies (Bhattacharya et al., 2011; Du et al., 2011). In addition, customer engagement and CSR have been linked to customer loyalty. Past findings by Jarvis et al., (2017) tinted the importance of engaging customers in the CSR strategy they prefer as it enhances not only the extra value to the organisation through customer loyalty to the organisation, but also customer engagement with the organisation. Businesses need to engage all the relevant public in terms of what they feel would be appropriate CSR activities. What the company may consider being socially responsible behaviour may be seen by stakeholders, especially investors, as a waste of company resources. Their voice is crucial.
Create or participate in events that promote giving
Companies need to establish and involve themselves in events that promote giving and fundraising for a cause. Creating or participating in events that promote giving or fundraising can generate major revenue for a cause. For example, Woolworths can tap into a national interest and host its own charitable flag football tournament. Charge an entry fee per team or ask participants to fundraise for entry. Another example is the company can host an annual 10-kilometer or 5-kilometer fun run where participants will be requested to pay a certain fee to enter to run or walk and the revenue generated can be used for donating. Another best example is that the company creates an event called Giving Friday which can be celebrated on Friday. This day will be all about giving back to the community. The company can give back its products especially food to local schools, and this movement can be largely fuelled by social media with the hashtag #GivingFriday and other companies can potentially follow the initiative and do the same.
7.3 Limitations
There is no study without limitations. Every study has its own problems. First, the questionnaire itself presented some limitations for the study. Firstly, respondents complained that it was too long. Although a pilot study was conducted to avoid this, some of the respondents also complained that they found some of the questions were too similar and felt this was unnecessary repetition. Second, given that it would have been time-consuming and impractical to do a provincial or national survey, the geographic boundary for the questionnaire-based survey was limited to customers who usually do their shopping at selected Woolworths stores within Pietermaritzburg. Last, the researcher used the convenience sampling technique. Respondents were selected on basis of availability and convenience until the targeted sample size was reached. It was deemed to be the most appropriate sampling technique considering that there was no access to a comprehensive sampling frame and already, and by virtue of this, the sample derived would not be representative of the target population regardless of the chosen sampling method. The findings of the study cannot, therefore, be generalised to the wider population. However, to overcome these limitations and maintain the effectiveness of this study, sincere efforts and hard work were put in place.
Contribution of the Study
This study makes several important contributions to the growing body of literature on Corporate Social Responsibility (CSR) and brand equity. First, it advances marketing scholarship by providing empirical evidence on the direct association between CSR and brand equity, a relationship that has been underexplored in prior research. By doing so, it offers novel insights into how CSR functions not only as a moral or ethical imperative but also as a strategic driver of brand value. Second, this study contributes to CSR scholarship by presenting evidence from the South African retail context, specifically Woolworths, thereby addressing the geographical bias that characterises much of the existing literature. The findings confirmed that CSR and its dimensions exerted a positive and significant influence on brand equity, suggesting that retailers can leverage CSR to enhance brand reputation and stakeholder trust. Finally, the study has important managerial implications. For Woolworths, and by extension other retailers, the results highlighted the necessity of embedding CSR into corporate strategy and acting as champions of social responsibility. Doing so not only strengthens corporate image but also fosters employee motivation, engagement, and a sense of pride in being associated with a socially responsible organisation.
7.4 Future Research
The findings of the current study suggested possibilities for future research opportunities that could be conducted in other geographic locations and for other types of retail stores or a different sector. In addition, further research should be conducted by carefully designing the in-depth interview (research instrument). It is suggested that a qualitative analysis or an interview should be done with some influential customers or those who have very frequent contact with an organisation, since they might have more personal experience with the organisation to improve the credibility of the findings. Sport sponsorship, as a CSR tool, has received little academic attention in the CSR domain (Peloza and Shang, 2011). While some initial research by Quester, Pettigrew, Kopanidis, Hill, and Hawkins (2013) has suggested the ability of sport sponsorship to build or sponsor CSR image, empirical investigations of whether sports sponsorship can facilitate the development of the CSR image are lacking. As a result, the researcher suggested that such a study should be conducted in the future. CSR and brand equity are dynamic in nature; therefore, this research is by no means conclusive. It opens a new dimension for further study, and it is proposed that more variables should be probed and empirically tested for further investigation. Additional research is required to address these findings and identify other variables affecting brand equity.
7.5 Conclusion
The primary objective of this study was to empirically examine the impact of Corporate Social Responsibility (CSR) on brand equity. The findings demonstrated that CSR initiatives were a critical driver of brand image and brand loyalty, both of which ultimately enhanced brand equity. The evidence suggested that through socially responsible initiatives, firms were able to foster favourable stakeholder attitudes and behaviours such as repeat purchases, talent attraction, investment interest, and long-term engagement. Over time, these initiatives contributed to the strengthening of stakeholder–company relationships, reinforcing brand image, and promoting advocacy behaviours, including positive word-of-mouth, employee commitment, and organizational citizenship (Du, Bhattacharya & Sen, 2010).
Nevertheless, the study also highlighted key challenges. Stakeholders’ limited awareness of, or skepticism towards, CSR activities remained significant obstacles preventing firms from fully realising the strategic benefits of CSR investments. While well-communicated CSR practices generated tangible and intangible value for firms, poorly communicated initiatives risked producing the opposite effect. Specifically, when CSR messages were perceived as inauthentic, overstated, or irrelevant, they could trigger negative publicity and erode brand equity.
Overall, this study affirmed that CSR, when strategically designed and effectively communicated, enhanced brand equity by shaping stakeholder perceptions and behaviours. Conversely, inadequate communication or misalignment between CSR actions and stakeholder expectations risked undermining these gains, thereby highlighting the dual potential of CSR as both a strategic asset and a reputational liability.
---
Author Contributions: Maxwell Phiri contributed to the conceptualization of the study, methodology design, formal analysis, and supervision. He also provided guidance in validation, resources, and review and editing of the manuscript. Simangaliso Zulu contributed to data curation, investigation, software application, visualization of results, and writing of the original draft. Both authors collaboratively contributed to writing, reviewing, and editing the manuscript and approved the final version for submission.
Acknowledgements: The authors wish to express their sincere gratitude to all individuals and organizations that contributed to the successful completion of this study. Special thanks are extended to the participants who generously provided their time and insights, enabling the collection of valuable data. The authors also acknowledge the support and guidance of colleagues and mentors who offered critical feedback during the research process. Additionally, appreciation is extended to institutional and administrative staff who facilitated access to necessary resources and ensured the smooth execution of the study.
Funding: This research was funded by the Moses Kotane Research Institute.
Conflicts of Interest: The authors state that they have no conflicts of interest.
---
Disclaimer/Publisher’s Note: The views, statements, opinions, data and information presented in all publications belong exclusively to the respective Author/s and Contributor/s, and not to Sprint Investify, the journal, and/or the editorial team. Hence, the publisher and editors disclaim responsibility for any harm and/or injury to individuals or property arising from the ideas, methodologies, propositions, instructions, or products mentioned in this content.
References
- Albus, H. and Ro, H., 2013. Corporate social responsibility: The effect of green practices in a service recovery. Journal of Hospitality & Tourism Research, 23(2), pp.1–25.
- Balsara, L., 2009. Make CSR part of your overall brand strategy. [online] Accessed on 01 August 2019.
- Bahta, D., Yun, J., Islam, M.R. and Bikanyi, K.J., 2021. How does CSR enhance the financial performance of SMEs? The mediating role of firm reputation. Economic Research-Ekonomska Istraživanja, 34, pp.1428–1451.
- Bhandari, P., 2020. Inferential statistics: An easy introduction & examples. [online] Accessed on 13 June 2020.
- Bhattacharya, C.B., Sen, S. and Korschun, D., 2011. How to co-create corporate responsibility strategy. Journal of Ethical Corporation, 8(1), pp.35–38.
- Brennan, B., 2020. The real reason women shop more than men. [online] Accessed on 21 May 2020.
- Burns, N., Grove, S.K. and Gray, J., 2015. Understanding nursing research: Building an evidence-based practice. Missouri, USA: Elsevier.
- Clementino, E. and Perkins, R., 2020. How do companies respond to environmental, social and governance (ESG) ratings? Evidence from Italy. Journal of Business Ethics, 37(1), pp.26–40.
- Cohen, L., Manion, L. and Morrison, K., 2011. Research methods in education. New York, USA: Routledge.
- Dapi, B. and Phiri, M.A., 2015. The impact of corporate social responsibility on brand loyalty. Journal of Governance and Regulation, 4(4), pp.8–16.
- DeFranco, S.E., 2018. Difference between qualitative and quantitative research. [online] Accessed on 29 April 2018.
- Delgado‐Ballester, E. and Luis Munuera‐Alemán, J., 2005. Does brand trust matter to brand equity? Journal of Product and Brand Management, 14(3), pp.187–196.
- Dong, D., Chang, H. and Wang, T., 2016. The CSR green halo effect on the corporate–public communication: An experimental study. Asian Journal of Communication, 27(2), pp.213–230.
- Du, S., Bhattacharya, C.B. and Sen, S., 2010. Maximizing business returns to corporate social responsibility (CSR): The role of CSR communication. International Journal of Management Reviews, 12(1), pp.8–19.
- Farquhar, P.H., 2017. Managing brand equity. Journal of Marketing Research, 1(3), pp.24–33.
- Fincham, J.E., 2008. Response rates and responsiveness for surveys, standards, and the journal. American Journal of Pharmaceutical Education, 72(2), pp.1–3.
- Guha, S. and Mandal, A., 2019. Socio-economic impact of corporate social responsibility: A review. International Journal of Scientific Research and Review, 8(5), pp.1293–1305.
- Hayes, A., 2019. Brand equity. [online] Accessed on 29 April 2019.
- Hea, Y. and Laib, K.K., 2014. The effect of corporate social responsibility on brand loyalty: The mediating role of brand image. Total Quality Management and Business Excellence, 25(3), pp.249–263.
- Hejase, H., Hayek, S.S., Qadri, S. and Haik, Y., 2012. MnZnFe nanoparticles for self-controlled magnetic hyperthermia. Journal of Magnetism and Magnetic Materials, 324(22), pp.3620–3628.
- Hejase, H.J., Hejase, A.J., Tabsh, H. and Chalak, H.C., 2016. Intellectual capital: An exploratory study from Lebanon. Open Journal of Business Management, 4(4), pp.571–605.
- Hohnen, P. and Potts, J., 2007. Corporate social responsibility: An implementation guide for business. Winnipeg, Canada: International Institute for Sustainable Development.
- Iriqat, R.A. and Abu Daqar, M.A.M., 2017. The role of customer relationship management on enhancing customer satisfaction in the banks in Palestine. Modern Applied Science, 11(12), pp.84–96.
- Jarvis, W., Ouschan, R., Burton, H.J., Soutar, G. and O’Brien, I.M., 2017. Customer engagement in CSR: A utility theory model with moderating variables. Journal of Service Theory and Practice, 27(4), pp.833–853.
- Jha, G., 2018. 6 Sampling techniques: How to choose a representative subset of the population. [online] Accessed on 05 January 2018.
- Keller, K.L., 2019. Strategic brand management: Building, measuring, and managing brand equity. Crystal City, USA: Pearson Hall.
- Laerd.com, 2018. SPSS statistics tutorials and statistical guides. [online] Accessed on 30 September 2018.
- Lynch, J. and De Chernatony, L., 2004. The power of emotion: Brand communication in business‐to‐business markets. Journal of Brand Management, 11(5), pp.403–419.
- McGregor, S.L.T., 2014. Consumer education via corporate social responsibility communication in websites: Lithuania banking sector. International Journal of Consumer Studies, 3(1), pp.2–18.
- Morgan, R., 2018. Woolworths increases lead in $100b+ grocery war. [online] Accessed on 03 May 2018.
- Pandey, P. and Pandey, M.M., 2015. Research methodology: Tools and techniques. Romania: Bridge Centre Publishers.
- Peloza, J. and Shang, J., 2011. How can corporate social responsibility activities create value for stakeholders? A systematic review. Journal of the Academy of Marketing Science, 39(1), pp.117–135.
- Quester, G.P., Pettigrew, S., Kopanidis, F., Hill, S.R. and Hawkins, D.I., 2013. Consumer behaviour: Implications for marketing strategy. Australia: McGraw-Hill Education.
- Raman, M., Lim, W. and Nair, S., 2012. The impact of corporate social responsibility on consumer loyalty. Kajian Malaysia, 30(2), pp.71–93.
- Ramesh, K., Saha, R., Goswami, S., Sekar, S. and Dahiya, R., 2018. Consumer’s response to CSR activities: Mediating role of brand image and brand attitude. Journal of Corporate Social Responsibility and Environmental Management, 26(2), pp.377–387.
- Rese, M., 2006. The explanatory foundations of relationship marketing theory: A comment. Journal of Business and Industrial Marketing, 21(2), pp.88–89.
- Salkind, N., 2019. Encyclopedia of research design, SAGE Research Methods. [online] Accessed on 25 May 2019.
- Saunders, R., 2006. The role of corporate social responsibility in strengthening multiple stakeholder relationships: A field experiment. Journal of the Academy of Marketing Science, 34(2), pp.158–166.
- Schmidt, C., 2019. Aaker model – Building brand identity step by step. [online] Accessed on 27 November 2019.
- Shamma, H.M. and Hassan, S.S., 2011. Integrating product and corporate brand equity into total brand equity measurement. International Journal of Marketing Studies, 3(1), pp.11–35.
- Sharma, R. and Jain, V., 2019. CSR, trust, brand loyalty and brand equity: Empirical evidence from sportswear industry in the NCR region of India. Metamorphosis, 18(1), pp.57–67.
- Singh, A. and Verma, P., 2017. Investigating the nexus of corporate social responsibility and brand equity: A systematic review. Indian Journal of Management, 10(2), pp.7–48.
- Smith, D.J., Gradojevic, N. and Irwin, W.S., 2011. An analysis of brand equity determinants: Gross profit, advertising, research, and development. Journal of Business and Economics Research, 5(11), pp.15–43.
- Wang, Z., Hsieh, T. and Sarkis, J., 2018. CSR performance and the readability of CSR reports: Too good to be true? Corporate Social Responsibility and Environmental Management, 25, pp.66–79.
- Woolworths Holding Report, 2016. Good Business Journey Report. [online] Accessed on 12 December 2017.
- Wu, S.I. and Lin, H.F., 2014. The correlation of CSR and consumer behaviour: A study of convenience store. International Journal of Marketing Studies, 6(6), pp.66–80.
- Yoon, M., Kim, I. and Lee, G.H., 2019. Is earnings quality associated with corporate social responsibility? Evidence from the Korean market. Journal of Sustainability, 11(15), pp.16–41.
- Young, K., 2019. Consumers going green: Everything you need to know. [online] Accessed on 29 May 2019.
- Zeithaml, V., Berry, L. and Parasuraman, A., 1996. The behavioural consequences of service quality. Journal of Marketing, 60(2), pp.31–46.
Article Rights and License
© 2025 The Authors. Published by Sprint Investify. ISSN 2359-7712. This article is licensed under a Creative Commons Attribution 4.0 International License.