KeywordsCold Chain Export Market FMEA Japan Market PDCA Product Defect Quality Control Quality Improvement Supply Chain Tuna Loin
JEL Classification M31, M11
Full Article
1. Introduction
Industrial development objectives, including the Tuna processing industry, are for the welfare of the people involved in this industry chain, ranging from Tuna Fishermen, Bench Stools / Collectors, Large Traders, Processors to Tuna Exporters.
The amount of benefits gained by each level of participants in the Tuna industry is highly dependent on the selling price of the Tuna itself (Jiang et al., 2016). The main determinant factor for the high and low selling prices received at each level, is very dependent on how much the buyer willing to pay the Tuna Loin from Aceh. At the same time, the desire of buyers to pay high prices depends on how good is the quality of tuna they can get (Maiti and Giri, 2015). In Aceh, the Tuna supply chain consists of 5 levels of the distribution chain, namely fishermen, collectors, wholesalers, processors and exporters. In many cases, the processor also functions as an exporter (Chan et al., 2017).
Efforts to increase the amount of tuna exported must be supported by an increase in the quantity, quality and added value of tuna itself (Wardono et al., 2015). Generally, companies that export tuna processed products have several challenges in running their business, including competition with similar companies, especially foreign companies, demands for the fulfilment of product quality standards that have been set for export markets, export capabilities with quantity according to buyer's request (Carballo et al., 2018). Thus, companies that want to survive must be able to produce quality products that are in line with the demands of consumers.
Low quality tuna will certainly be rejected by the buyer and cause great losses. For example in the period March - May 2018, only from one supplier there was no less than 426 Kg of defect product, either not passed the final QC in the processing or rejected by the buyer. If it was assumed that the selling price of exporters was USD 10 / kg then there was USD 4,260 of losses suffered by the Aceh Tuna industry due to the low quality of Tuna Loin produced (UD Nagata Tuna, 2018).
Seeing the importance of quality control at the processor level, may previous researchers have made a lot of studies in this field, to see what variables were the cause of the decline in the quality of Tuna Loin. In maintaining the quality of the products produced, it requires continuous quality improvement (Moin et al., 2018). Quality control is carried out to produce quality product that is in line with the expected demands (Mitra, 2016). Control techniques and product quality improvement can be analyzed using the Six Sigma method (Jairaman et al., 2017). Other researchers use the PDAC technique which stands for Plan, Do, Act and Control to make sure the production process has zero defect (Moen and Norman, 2006).
Although many researchers have examined this problem, for small-scale processing like the one in Banda Aceh, no one has examined it yet. Because this small-scale processing has more human power. In other words, Tuna processing is still be done manually. So there will be more variables that must be controlled compare to large-scale processing that has been run automatically (Nallusamy et al., 2015). Research on improving the quality of Tuna with PDCA method as long as the author's knowledge has never been done before in Aceh
To minimize the causes of failure in maintaining product quality, the authors added Failure Mode and Effects Analysis (FMEA) production monitoring equipment, which was adopted from the automotive production quality control process at Ford Motor Company (Luo et al., 2015). FMEA is a structured procedure to identify and prevent as many modes of failure as possible during the production process (Dobryden et al., 2017). The decline in the defect level of this product is a critical point to reduce the number of customer complaints in order to maintain the business continuity (Birim et al., 2016).
The findings from this study can later be used as a model for the development of small-scale tuna industry that can be used and generalized to similar companies in all coastal areas of Indonesia.
2. Literature Review
2.1. Understanding Quality
Pianta et al. (2016), define the quality as a fulfilment of requirements by minimizing the damage that may arise or known as zero defect standard. Whereas Goetsch et al. (2014) came up with a broader definition of quality. The quality is a dynamic condition that deals with products, services, people, processes, and environments that meet or exceed expectations. Different perspectives have been derived from the last decade to understand the term "quality". Every customer established some needs and these needs should be transformed into measurable characteristics. The final aim is to make the customer satisfied for what they paid for a service or a product. Some of the definitions are as follows (Kumar et al., 2016): • Quality is fitness for the purpose • Quality is a degree of customer satisfaction • Quality is accuracy in meeting the specification or design • Quality is meeting the standards or norms • Quality is a degree of excellence.
2.2. Quality Control
According to Goetsch et al. (2014), quality control is an effective control system to coordinate quality maintenance efforts, and improve the quality during a production process, to satisfy consumer needs and desires. Mitra (2016) said that quality control is as an effective tool in reducing product defect.
2.3. PDCA
As stated by Moin et al. (2018), PDCA is a model for continuous improvement by planning, doing, checking, and acting. The PDCA cycle is generally used to test and implement changes to improve the performance of products, processes or a system in the future. As stated by Moen, R. and Norman, C. (2006), explanation of the stages in the PDCA cycle is Develop a plan (Plan), Carry out a plan (Do), Check or examine the results achieved (Check), and Make adjustments when needed (Action). There were 7 tools developed for PDCA, namely: 1. Check Sheet 2. Histogram 3. Pareto Diagram 4. Flow Chart 5. Scatter Diagram 6. Control Chart 7. Fish Bone Diagram. (Varsha et al., 2014).
2.4. Failure Mode and Effects Analysis (FMEA)
Liu et al. (2015) mentioned that FMEA is a structured procedure to identify and prevent as many failure modes as possible. They added that a failure mode is anything that is included in the defect, conditions outside the specified specifications, or changes in the product that cause disruption of the function of the product. The stages of applying FMEA are as follows 1. Descriptions and Objectives 2. Identifying Potential Failure Modes 3. Identifying Potential Failure Effects 4. Determining Severity Rating 5. Identifying Causes of Failure Potential 6. Determining Rating of Occurrence 7. Identification of Detection Level 8. Calculating Risk Priority Number (Dobryden et al., 2017).
3. Research Methodology
This research is an exploratory research that aims to determine the causal factors that cause problems. To solve this problem PDCA method is used by doing observation in the fish processing unit starting from the material reception until the final product processed. It does by improving the weakness of the process such as tightening the time of purchasing, adding fish containers, improve cooling room temperature, standardization of production process, providing dry ice inside the packaging to maintain the quality of loin. Then, evaluating the number of defect and compare it to the previous one. Last step is to do the standardization of the process and publish Standard Operation Procedures booklet as a guide to be followed during the production stage.
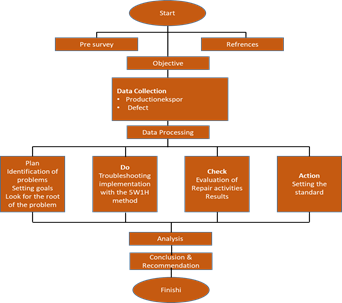
Figure 1. Research Process
The primary data is obtained through direct interviews and direct field observations. While the secondary data to support this research is obtained from the documentation process data that exists in the company, including the amount of production and the number of product defects. The improvement process was supported by 7 quality control tools namely Check sheet, Histogram, Pareto chart, Control chart, Fishbone diagram, and Failure Mode and Effects Analysis (FMEA).
4. Results and Discussion
The following were the results of this study which were presented in the order of the PDCA approach.
4.1. Step 1: Plan
The first step in the improvement plan was to collect production data, the number of defects, and the type of defect. The information was recorded in the check sheet.
a. Defect product consists of two types, namely Color and Texture.
Table 1. Defect Products
| No | Month | Defect | Amount (Kg) | Percentage (%) | Production (Kg) |
| 1 | Mar-18 | Color | 90.00 | 7.50% | 1200 |
| Texture | 60.00 | 5.00% | |||
| 2 | Apr-18 | Color | 82.50 | 6.50% | 1100 |
| Texture | 52.80 | 4.80% | |||
| 3 | May-18 | Color | 86.25 | 6.70% | 1150 |
| Texture | 51.75 | 4.50% |
b. Histogram was used to help determine the spread of the number of defects so that it could be found the types of product defects that occur most often.
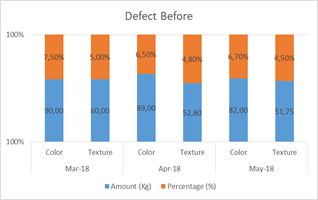
Figure 2. The level of Product Defect
c. Pareto diagram was used to describe what types of defects often occur frequently. The following is a Pareto diagrams for the period March-May 2018
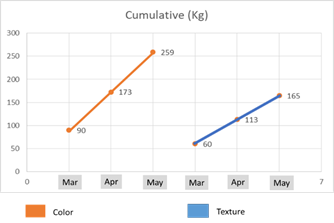
Figure 3. Scatter of Product Defect
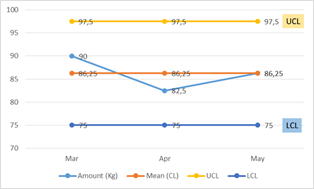
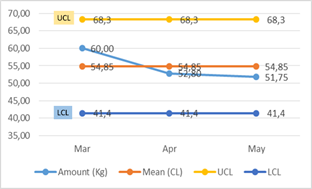
d. Control Chart was used to see whether the quality control process that had been carried out had been controlled.
|
|
| Color Defect | Texture Defect |
Figure 4. UCL, LCL and CL for Color and Texture Defects
e. The causal diagram or commonly called fishbone diagram was useful to show the main factors as source of the causes of the defect during production activities.
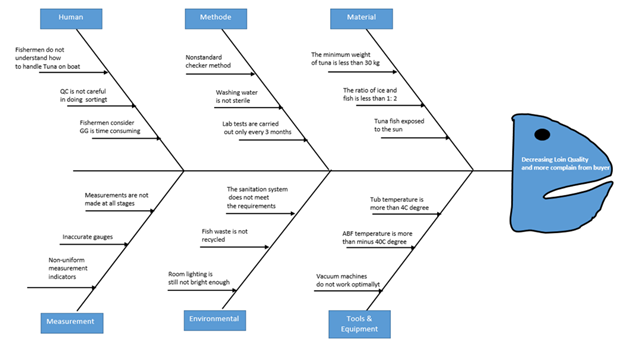
Figure 5. Fishbone
f. Failure Mode and Effects Analysis (FMEA) was adopted from Ford Motor Company to describe which type of defect that has more significant impact compare to the others.
Table 2. FMEA
| No | Defect Mode | Defect Effect | Cause of Defect | Detection Process | S | O | D | RPN |
| 1 | Color | Plain Color | exposed to sunlight | Random sampling | 4 | 5 | 4 | 80 |
| 2 | Texture | Bad Texture | Broken Cold Chain | Random sampling | 4 | 6 | 5 | 120 |
Note: S: Severity 1-10; O: Occurrence 1-10; D: Detection 1-10;
RPN: Risk Priority Number (OxD)
g. Corrective Action Plan. Corrective action was basically the plan to
overcome two problems regarding color and texture. To solve color problem
there were 5 variables to be corrected.
Table 3. Color Correction Plan
| No | Causes | What | Why | How | Where | Who |
| Description | Ideas | Measures of Success | How to apply | Location | PIC | |
| 1 | Processing room is not bright enough | Adding light intensity | Space becomes bright | Additional lights in the checked room | Special checker room | Engineering Section Employee |
| 2 | Fish inspection is not strict | Tightening the quality of fish during the inspection on board | The whole tuna that is purchased really has sashimi grade quality | Socialization of tuna fishers | On the ship | Checker clerk |
| 2 | The temperature in process room |
Repair the cooling engine as soon as possible with a maximum temperature of 20oC |
The maximum process room temperature is 20oC | Special mechanical cooling machine call (AC) | Production room | Mechanical officer |
| 3 | Change of process flow |
Establishing a fixed standard for the flow of the production process for fresh loin tuna |
Every production process must have a fixed flow | Re-adjustment of the right production space | Production room | Production staff and employees |
| 4. | Packaging only uses ice jelly | Providing dry ice for each box of fresh tuna loin | Decreasing complaints from customers | Purchasing dry ice every time there is a production process | Packing room | Production employees |
While to make correction for Texture problems, there were 2 variables need to be revised.
Table 4. Texture Improvement Plan
| No | Causes | What | Why | How | Where | Who |
| 1 | Rough handling |
The awareness of employees is the importance of good and smooth handling of fish that are still intact |
Tuna loin does not become soft and broken | Dissemination of whole fish reception officers. | Raw material reception room | Production officer |
| 2 | Manual transfer of fish | Adding tools to facilitate the process of moving fish | Tuna loin does not become soft and breaks when loin | Provision of aids for the removal of fish | Production and acceptance of raw materials | Production officer |
4.2. Step 2: Do
Improvements was made to reduce defects due to the decrease in color quality with the 5W + 1H
a. Color Correction. There were 5 stages used to solve 5 problems that cause the drop in color quality.
Table 5. Color Correction No. 1
| 5W+1H | Descriptions | ||
| The checker room is not bright enough | What | Proposed improvements: Adding light intensity | |
| Why | Checker work that relies on visuals becomes less accurate | ||
| Who | Checker Officer | ||
| Where | Production room/checker | ||
| How |
The improvement step done here is by comparing the intensity of the light before and after repaired |
||
| Before repaired | After repaired | ||
| The plug is not optimal in checking the quality of the fish | Checkers are more accurate in checking ship quality | ||
This was the problem regarding the light in the checker room. It should be added more light to increase the brightness of the room.
Table 6. Color correction Cause No. 2
| Problem | 5W+1H | Descriptions | |
| Fish inspection is not strict | What |
Proposed improvements: Tightening the quality of fish during the inspection on board |
|
| Why |
The whole tuna that is purchased really has sashimi grade quality |
||
| Who | Checker Officer | ||
| Where | Above the ship/place of a demolition of tuna | ||
| How |
The improvement step taken here is by comparing the quality of tuna fish that is in accordance with the wishes of consumers and which is not appropriate. |
||
| Before repaired | After repaired | ||
|
Checkers are less strict in checking every purchase of fish |
The plug is tighter when checking fish while on board |
||
In this inspection activity, make sure the checker did his job appropriately to reject all low quality material during the inspection process.
Table 7. Color correction Cause No. 3
| Problem | 5W+1H | Descriptions | |
| Hot temperature in the process room | What |
Proposed improvements: Repair the cooling engine as soon as possible with a maximum temperature of 20oC |
|
| Why | The maximum process space temperature must be 20oC | ||
| Who | Refrigerator mechanic | ||
| Where | Production process room | ||
| How |
The corrective steps taken here are a special mechanical call for a cooling machine (AC) |
||
| Before repaired | After repaired | ||
| Temperature space between 27oC - 30oC | Temperature process space is a maximum of 20oC | ||
Table 8. Color correction Cause No. 4
| Problem | 5W+1H | Descriptions | |
| Change of process flow | What |
Proposed improvements: Establish a fixed standard for the flow of fresh loin tuna production process |
|
| Why | Every production process must have a fixed flow | ||
| Who | Production staff and employees | ||
| Where | Production process room | ||
| How | Re-adjustment of the right production space | ||
| Before repaired | After repaired | ||
|
The production process changes and the process flow is longer. |
The process flow is shorter and shorter. | ||
During the processing time, the cold chain had to be there, including the temperature in processing room.
Table 9. Color correction Cause No. 5
| Problem | 5W+1H | Descriptions | |
| Packaging only uses ice jelly | What |
Proposed improvements: Giving dry ice to each box of fresh tuna loin |
|
| Why | Decreasing complaints from customers | ||
| Who | Production employees | ||
| Where | Packing room | ||
| How |
Purchasing dry ice every time there is a production process and giving to each tuna loin box |
||
| Before repaired | After repaired | ||
| The packaging process only uses ice jelly |
The use of sugar ice and ice jelly as cooling media in Styrofoam |
||
Jelly ice was always the problem since the stock of jelly ice was limited. Need to buy sufficient amount of jelly ice so every boxes shipped has enough jelly ice on it.
b. Texture Correction
There were two major problems need to be solved regarding the low quality of the texture.
Table 10. Texture Correction No.1
| Problem | 5W+1H | Descriptions | |
| Rough Handling | What |
Proposed improvements: Socialization of employees is important for the good and smooth handling of fish that are still intact |
|
| Why | Tuna loin does not become soft and broken | ||
| Who | Employees produce reception | ||
| Where | Raw material reception room | ||
| When | June 1, 2018 | ||
| How | Socialization of whole fish reception officers | ||
| Before repaired | After repaired | ||
| Employees move whole fish roughly | Employees are more careful in handling whole fish | ||
The employees need to treat the tuna carefully as a baby, to avoid a texture problem.
Table 11. Texture Correction No.2
| Problem | 5W+1H | Descriptions | |
| Manual transfer of fish | What |
Proposed improvements: Add tools to facilitate the process of displace fish |
|
| Why | Tuna loin does not become soft and breaks | ||
| Who | Production employees | ||
| Where | Raw material reception room | ||
| When | June 2018 | ||
| How | Addition of tools for the process of displacing fish | ||
| Before repaired | After repaired | ||
| Employees displace whole fish roughly | Employees are easy and light in moving fish | ||
It is suggested to use supporting equipment to mobilize fish from one place to another to make sure the tuna always in a better condition
4.3. Step 3: Check
a. Check Sheet. The first step at this stage was to collect production and defect data in the period of June - August 2018. The following table shows the information about defect product after the improvement.
Table 12. Defect After Improvement
| No | Month | Defect | Amount (Kg) | Percentage (%) | Production (Kg) |
| 1 | Jun-18 | Color | 54.00 | 7.50% | 1350 |
| Texture | 40.50 | 5.00% | |||
| 2 | Jul-18 | Color | 51.00 | 6.50% | 1275 |
| Texture | 31.88 | 4.80% | |||
| 3 | Aug-18 | Color | 60.84 | 6.70% | 1352 |
| Texture | 37.18 | 4.50% |
b. Below was histogram of the defect after improvement.
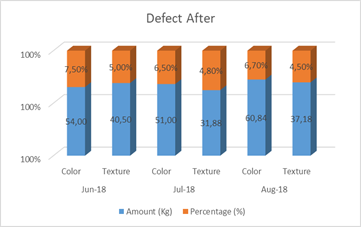
Figure 6. The Defect after the Improvement
c. Pareto Diagram
After the data of June-August 2018 period was collected, the next step was to make a Pareto diagram to make it easier to see for each type of defect.
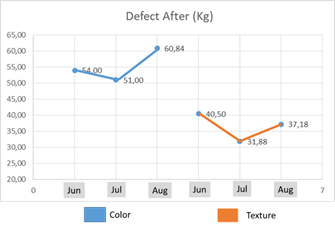
Figure 7. Pareto Diagram after the Improvement
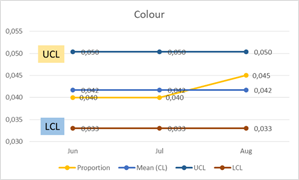
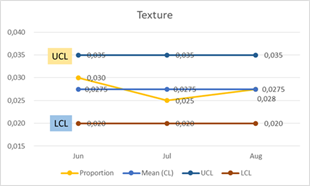
d. Control Chart.
After making a Pareto diagram, the next step was to do an analysis using a control chart to find out whether the corrective actions that had been carried out were successful or not
Table 12. Color After the Improvement
| No | Month | Production (Kg) | Amount (Kg) | Mean (CL) | Proportion | Mean (CL) | SD | UCL | LCL |
| 1 | Jun | 1350 | 54 | 55.28 | 0.040 | 0.042 | 0.003 | 0.050 | 0.033 |
| 2 | Jul | 1275 | 51 | 86.25 | 0.040 | 0.042 | 0.003 | 0.050 | 0.033 |
| 3 | Aug | 1352 | 61 | 86.25 | 0.045 | 0.042 | 0.003 | 0.050 | 0.033 |
Table 13. Texture After the Improvement
| No | Month | Production (Kg) | Amount (Kg) | Mean (CL) | Proportion | Mean (CL) | SD | UCL | LCL |
| 1 | Jun | 1350 | 41 | 36.52 | 0.030 | 0.0275 | 0.0025 | 0.035 | 0.020 |
| 2 | Jul | 1275 | 32 | 54.85 | 0.025 | 0.0275 | 0.0025 | 0.035 | 0.020 |
| 3 | Aug | 1352 | 37 | 54.85 | 0.028 | 0.0275 | 0.0025 | 0.035 | 0.020 |
|
|
Figure 8. UCL, CL and LCL after the Improvement
e. The result. The following is the data before and after the Improvement.
Table 14. Comparison Before and After
| Before | After | Difference | Difference (%) | ||||
| Color | Texture | Color | Texture | Color | Texture | Color | Texture |
| 0.075 | 0.050 | 0.040 | 0.030 | 0.035 | 0.020 | 47% | 40% |
| 0.081 | 0.048 | 0.040 | 0.025 | 0.041 | 0.023 | 51% | 48% |
| 0.071 | 0.045 | 0.045 | 0.028 | 0.026 | 0.018 | 37% | 39% |
| Average | 45% | 42% | |||||
By seeing the information in the table we could recognize that there was a significant impact in decreasing both the defect of color and texture by 45% and 42% respectively.
4.4. Step 4: Action
After several corrective actions had been taken in the production activities in June 2018 and re-checking the results of repairs during the June-August 2018 period, it could be seen that the quality problems that occur had been minimized. The defect rate decreased by 45% and 42% respectively for Colour and Texture. The next step was to maintain the results that had been achieved to prevent the recurrence of the same problem happen again as well as for the purposes of quality control in the future. This is what we call a standardization process or Action in PDCA approach. This standardization should be written in operational procedures (SOPs) and posted on the walls of the production room. The standards that had been set was not a fixed or final. It can be modify whenever needed.
5. Conclusion and Limitation of the Study
From the results and findings of this study, we understand that there were a significant decrease of both color and texture defect by 45% and 42%. Thus Tuna Loin processing companies, especially small-scale ones, can implement the same approach in solving problems related to low quality of Tuna to improve the quality to meet buyer expectation. By providing a good quality of Tuna loin, hopefully the complaint from buyer also decrease significantly because we have enough good quality product to be shipped to them.
Because this research is very limited in the scope, the future research related to quality improvement can be expanded by representing Tuna processing companies on a larger scale, so that the results can be generalized to give some contribute to the knowledge related to the product quality.
References
- Birim, S., Anitsal, M. M. and Anitsal, İ., 2016. A Model Of Business Performance In The Us Airline Industry: How Customer Complaints Predict The Performance?. Business Studies Journal, 8(2), pp.77-90.
- Carballo, J., Ottaviano, G. I. and Martincus, C. V., 2018. The buyer margins of firms' exports. Journal of International Economics, 112, pp.33-49.
- Chan, S., Tabrani, M. and Fitri, F. A., 2017. Increasing The Quality Of Tuna To Fulfill Japan Export Market Preferences [online] Available at: http://digilib.unimed.ac.id/28340/ [Accessed on 11 December 2018].
- Dobryden, A., Rutter, B., Hartl, D. and Bramson, E., 2017. Failure mode avoidance approach for hybrid electric vehicle systems. SAE International Journal of Engines, 10, pp.222-226.
- Goetsch, D. L. and Davis, S. B., 2014. Quality management for organizational excellence. Upper Saddle River, NJ: Pearson.
- Handoko, A., 2017. Implementation of quality control using the PDCA and seven tools approach on PT. Rosandex PP in Surabaya. Calyptra, Surabaya University Student Scientific Journal, 6(2), p.1.
- Jairaman, J., Sakiman, Z. and Li, L. S., 2017. Sunway Medical Laboratory Quality Control Plans Based on Six Sigma, Risk Management and Uncertainty. Clinics in laboratory medicine, 37(1), pp.163-176.
- Jiang, B., Tian, L., Xu, Y. and Zhang, F., 2016. To share or not to share: Demand forecast sharing in a distribution channel. Marketing Science, 35(5), pp. 800-809.
- Kumar, M. P., Raju, N. V. S. and Kumar, M. S., 2016. Quality of Quality Definitions–An Analysis. International Journal of Scientific Engineering and Technology, 5, pp.142-148.
- Liu, H.C., You, J.X., You, X.Y. and Shan, M.M., 2015. A novel approach for failure mode and effects analysis using combination weighting and fuzzy VIKOR method. Applied Soft Computing, 28, pp.579-588.
- Luo, S. H. and Lee, G. G., 2015. Applying failure mode and effects analysis for successful knowledge management. Total Quality Management and Business Excellence, 26(1-2), pp.62-75.
- Maiti, T. and Giri, B. C., 2015. A closed loop supply chain under retail price and product quality dependent demand. Journal of Manufacturing Systems, 37, pp.624-637.
- Mitra, A., 2016. Fundamentals of quality control and improvement. New York: John Wiley and Sons.
- Moen, R. and Norman, C., 2006. Evolution of the PDCA cycle. [online] Available at: http://cissp.tjscott.net/standards/ moen.norman.pdca.origins.pdf [Accessed on 11 December 2018].
- Moin, C. J., Doulah, A. S. U., Ali, M. and Sarwar, F., 2018. Implementation of an operating procedure for quality control at production level in a RMG industry and assessment of quality improvement. The Journal of The Textile Institute, 109(4), pp.524-535.
- Nallusamy, S., Dinagaraj, G. B., Balakannan, K. and Satheesh, S., 2015. Sustainable green lean manufacturing practices in small scale industries-A case study. International Journal of Applied Engineering Research, 10(62), pp.143-146.
- Pianta, R., Downer, J. and Hamre, B., 2016. Quality in early education classrooms: Definitions, gaps, and systems. The Future of Children, pp.119-137.
- Chase, R.B., Aquilano, N.J. and Jacobs, R.F., 2001. Operations Management for Competitive Advantage. 9th Edition, New York: Mc GrawHill Companies.
- Singh, A.P., 2013. Quality Improvement Using Statistical Process Control Tool in Glass Bottles Manufacturing Company. International Journal for Quality Research, Vol. 7, pp.107-126.
- Tague, N. R, 2005, The Quality Toolbox, 2th ed., Milwaukee, Wisconsin: ASQ Quality Press.
- Magar, V.M. and Shinde, V.B., 2014. Application of 7 Quality Control (7 QC) Tools for Continuous Improvement of Manufacturing Processes. International Journal of Engineering Research and General Science, 2(4).
- Wardono, B., Fauzi, A., Fahrudin, A. and Purnomo, A. H., 2015. Value-Added Business Based On Small Scale Of Fisheries: A Case Study On Nortern And Shouthern Coasts Of Java (Lamongan And Pelabuhanratu Regency), Indonesia. International Journal of Scientific and Technology Research, 4(8), pp.134-139.
Article Rights and License
© 2019 The Authors. Published by Sprint Investify. ISSN 2359-7712. This article is licensed under a Creative Commons Attribution 4.0 International License.