Keywordscommitment loyalty reputation satisfaction service quality trust value
JEL Classification M31
Acknowledgment:
I would like to acknowledge the assistance provided by the language editor as well as the statistician.
Full Article
1. Introduction and Background
Owing to ongoing disruptions in learning due to the COVID-19 pandemic, higher education institutions are operating in virtual and Open Distance Electronic Learning (ODeL) environments to improve student support and enhance the success of online teaching and learning in an ODeL context (University of South Africa, 2019). This has led to students across the globe embracing distance learning on an unprecedented scale. However, this action has presented institutions of higher learning with challenges of satisfying and gaining loyalty as most of these higher learning institutions are not prepared for this mode of learning. Approximately 90% of students enrolled in public universities participated in online learning programs in 2020 in South Africa. However, these institutions are found to be lacking in adapting and effectively serving the new demand for distance learning (Nasution et al., 2019).
The rapid advancement of information and communication technology is changing the way educational institutions perform. Owing to economic, societal, and political changes, online learning (e-learning) is the current dominant paradigm for institutions of higher learning (Ansari, and Sanayei, 2012, p.137; Wu, 2016). Therefore, there is a need to understand the relevance of e-learning and how distance learning institutions can successfully harness the competitive advantage provided.
Higher education learning institutions continue to face local and international compétition, which reduces student’s retention and attraction (Masserini et al., 2019). Higher learning institutions must be dedicated to offering programs to students as their customers to attract new students and keep the existing ones towill achieve customer loyalty (Endah et al., Andriani, 2017). Thus, student loyalty will reduce the number of students who drop out from their studies and increase student commitment (Goolamally and Latif, 2014b; Latif and Bahroom, 2014;Martinez–Arguelles and Batalla–Busquets, 2016). Therefore, the main purpose of this study is to develop a framework for attaining student loyalty in an ODeL institution in the higher education sector in South Africa.Thus, the research objectives for this study are as follows:
- To determine if service quality influences satisfaction
- To determine if institutional reputation influences satisfaction
- To determine if satisfaction influences commitment
- To determine if satisfaction influences trust
- To determine if satisfaction influences loyalty
- To determine if commitment influences loyalty
- To determine if trust influences loyalty
- To determine if satisfaction mediates the effect of service quality, value, and reputation on loyalty
2. Literature Review
2.1 Model and Hypotheses Development
The student satisfaction concept of Henning-Thurau et al. (2001) was developed on the “relationship quality-based student loyalty” (RQSL) model. The RQSL model is composed of three components: student perception, student trust, student commitment. The weakness of the model is that it does not include student satisfaction as a meditating factor for student loyalty. The model shows that student commitment and service quality are major factors of student loyalty; however, it indicates that trust has no significant on student loyalty. Wong et al. (2017:182) stated that examining students' satisfaction in relation to institutional reputation and branding is important in improving the quality of teaching. Additionally, previous studies suggested that future research should be conducted to examine the influence of student’s loyalty and service quality mediated by student satisfaction (Pham et al., 2019; Rodic Lukic and Lukic, 2018). Based on the above research gap, this study aims to develop a framework for achieving student loyalty and as stated by Pham (2019). It seeks to examine the mediating effect students’ satisfactionhas on loyalty.Figure 1 presents the main relationships examined in this paper.
2.2 An Overview of Satisfaction as a Mediator between Causes and Outcomes
Universities improve retention by viewing students as customers (Guilbault, 2016). Successful managers must treat students as customers for better recruitment and retention. Churchill and Surprenant (1982) defined customer satisfaction as the extent to which the customer is pleased or displeased after the product is bought and used. Service quality and satisfaction have strong bonds, significantly correlated and influenced by the educational context (de Oliveira Santini et al., 2017). Several studies reported that student satisfaction positively correlates with student loyalty (Alves and Raposo, 2007; Chandra et al., 2018; Chen, 2016; Helgesen and Nesset, 2007; Kunanusorn and Puttawong, 2015; Shahsavar and Sudzina, 2017). Additionally, studies found that service quality has a strong influence on customer satisfaction in the clothing retailing industry (Brady et al., 2002; Cronin et al., 2000; Wu, 2014). In the traditional learning of higher private education, studies confirmed that service quality has a strong relationship with student loyalty for undergraduate students (Brown and Mazzarol, 2009; Dericks et al., 2019).
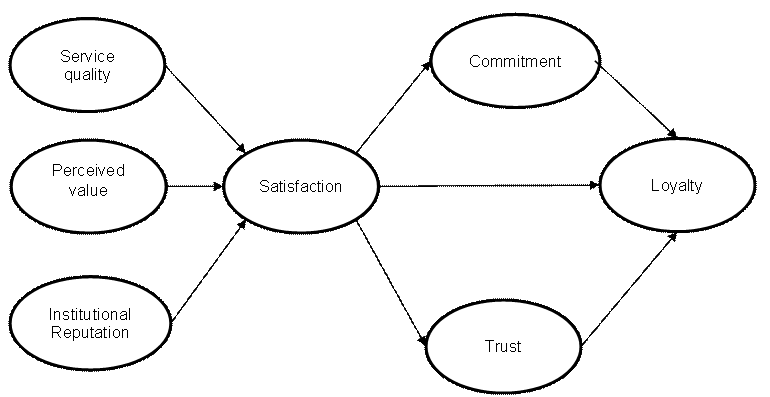
Figure 1. Proposed conceptual model
2.2.1.Service Quality and Satisfaction
The terms ‘student satisfaction’ and ‘quality’ have been central to the philosophy of higher education authorities. Their importance continues along with the promise of a renewed, foreseeable prosperity for the higher education of the future (Nadiri et al., 2009). As mentioned already, the higher education service quality framework comprises six factors initially: non-academic aspects, academic aspects, reputation, access, program issues, and understanding (Firdaus, 2005). Faizan et al. (2016) reported that all five dimensions of higher education service quality within the structure of higher education sector influenced student satisfaction, which is an important implication for the research model to be proposed in this study. Considering the importance of the relationship between service quality and student satisfaction in the higher education setting, as well as the significance of all five higher education service quality dimensions developed by Firdaus (2005) and tested by different researchers (Brochado 2009; Faizan et al., 2016.), the author proposed the following hypothesis.
Hypothesis 1: Service quality has a significant direct, positive effect on student satisfaction.
2.2.2 Perceived Value and Satisfaction
The relationship between customer satisfaction and perceived value is quite frequent on the agenda of researchers. Dovaliene et al. (2015), Lai et al. (2019), McDougall and Levesque (2000), Patterson and Spreng (1997), Akinci et al. (2015), and Gallarza and Saura (2006) are just a few authors who dealt with these variables in their studies. Most researchers suggested a positive influencing relationship between perceived value and customer satisfaction, meaning that the first one impacts the latter one. Accordingly, Dovaliene et al. (2015) reported empirical evidence in their study; they argue that a relationship between perceived value and student satisfaction exists. The results of the study conducted by McDougall and Levesque (2000) revealed that core service quality and perceived value were the most important drivers of customer satisfaction. Gallarza and Saura (2006) confirmed a quality–value–satisfaction–loyalty chain. In contrast, Akinci et al. (2015) suggested that perceived value has a mediating role between satisfaction and loyalty intentions. Considering that most of the literature has proposed, tested, and proved the positive, significant, and influential relationship between customer satisfaction and perceived value, the following hypothesis is developed for this study:
Hypothesis 2: Student perceived value has a direct, positive, and significant effect on student satisfaction.
2.2.3 Institutional Reputation and Satisfaction
Customer satisfaction frameworks are prevalent among researchers (Oliver, 1997; Giese and Cote, 2000; Wiers-Jenssen et al., 2002). The construct is similar to an attitude as it can be assessed as the sum of the satisfaction with a product or service (Churchill and Suprenant, 1982). Several studies have tested the determinants of customer satisfaction on a different perspective that include search time in choosing service (Andersen and Sullivian, 1993), Prio experience (Bottom and Dreww, 1991), getting information (Oliver and MacMillan, 1992), and attribute level of performance (Oliver et at., 1992). Parasuraman et al.’s (1988) satisfaction level is determined by the difference between service performances and customer perception and what the customer expects. Neither of these studies has tested the determinants of student satisfaction in higher education in an ODeL institution. An adaption of the customer satisfaction framework in the higher education system is proposed by Elliot and Heally (2001), who found that student satisfaction results from the evaluation of their experience with the education service received. Student satisfaction is influenced by various factors (Elliot and Heally, 2001). The institutional factors such as educational experience, teaching style (Dana et al., 2001), quality and promptness of feedback from lecturers and supervisors (Fredericksen et al., 2000), and personal factors that include age, gender (Brokaw et al., 2004; Stokes, 2003). The following hypothesis was formulated:
Hypothesis3: Institutional reputation has a positive influence on student satisfaction.
2.2.4 Satisfaction and Commitment
Any education institution's main responsibility is to increase students' commitment to the institution (Lai and Pham, 2019). Students' commitment to their existing institutions increases when they can learn and progress in the institution (Ayuni and Mulyana, 2019). Chen (2017) defined student commitment as a strong conviction in and appreciation of a higher learning institution, as well as a deep desire to keep the relationship with the institution going. Higher job satisfaction increases employees' commitment to the organization (Hakim and Hidayat, 2018; Nasution et al., 2019; Puspitawati and Riana, 2014). Similarly, Xiao and Wilkins (2015) study revealed that an institution's commitment to employee success and social inclusion is associated withemployee satisfaction.Consumer satisfaction with a product or service is critical in determining customer loyalty and repeat purchases (Mpinganjira et al., 2014). This statement is supported by Samudro et al. (2019), who found that satisfaction does not have a direct influence on loyalty unless commitment is used as a mediator. In addition, Rather andSharma (2017) explored the relationship and importance of consumer satisfaction, commitment, and loyalty in the tourism industry. The results showed that customer satisfaction has a positive effect on commitment (Rather and Sharma, 2017). However, Mpinganjira et al. (2017) found no direct influence between economic satisfaction and commitment. Therefore, the following hypothesis was formulated:
Hypothesis 4: There is a significant positive influence on students’ satisfaction with the ODeL institution and their commitment to the institution.
2.2.5 Satisfaction and Trust
Trust is the belief that the other party's commitment is reliable and that they will follow through on their promises (Han and Hyun, 2015). Students' trust in higher education institutions is founded on student’s confidence in the integrity and reliability of those who work there (Rodi et al., 2018). Thus, trust is derived from a students' personal experiences with the institution. Previous researchers have established a positive correlation between trust and satisfaction (Christou, 2010, Yuksel et al., 2008). Specifically, it has been observed that an individual needs to be satisfied before they can trust (Chiou and Pan, 2009; Martnez and Del Bosque, 2013). According to Endah et al. (2017), satisfaction has a strong influence on trust in the agriculture industry. Chiu et al. (2012) found that consumers’ satisfaction has a direct and positive effect on their trust in online retailers. Similarly, Mpinganjira et al. (2017) revealed thateconomic satisfaction has a positive direct effect on trust in the buyer-seller market. As a result, it is reasonable to conclude that educational institutions should first satisfy their students before trusting them. The following hypothesis was formulated:
Hypothesis 5: Student satisfaction has a significant positive effect on student trust and influence on student loyalty.
2.2.6 Commitment and Loyalty
Another construct to determine loyalty is customer commitment in the small and medium enterprises engineering sector (Esterhuizen, 2015). Students’ commitment to the e-learning educational institution is another construct to be tested in this study as a determinant of student loyalty in the RQSL adopted model. The committed party believes in the status of the relationship and makes efforts to preserve and ensure its distant future (Morgan and Hunt, 1994). It is also an emotional force that arouses bonds and proof of identity with the university. In a traditional education learning context, most studies reported that commitment has a significant and positive effect on student loyalty in a traditional education sector (Hennig et al., 2001; Orozco Encinas and Cavazos Arroyo, 2017; Rojas et al., 2009). Thus, the following hypothesis is proposed:
Hypothesis 6: Commitment has a significant and positive effect on student loyalty.
2.2.7 Trust and Loyalty
The trust that the student has in the institutional personnel is reflected by the student’s confidence in the institution’s integrity (Morgan and Hunt, 1994). The reliability of students is based on the personal experiences of members of staff such as lecturers, supervisors, and administration staff (Marimo et al., 2013). Do the staff members assist the student’s query, have the announcement or preparation of future lectures or services become reliable? Chiou and Pan (2009), Martnez and Del Bosque (2013) support that trust has a significant positive impact on customer loyalty. Trust is also understood to have a direct antecedent impact on customer loyalty in airline servicing companies. Thus, the following hypothesis is proposed:
Hypothesis 7: Students’ trust in the educational institution has a significant positive impact on student loyalty.
2.2.8 Satisfaction and Loyalty
The relationship between student satisfaction and loyalty was addressed in the literature. Many researchers such as Brown and Mazzarol (2009), Faizan et al. (2016), Helgesen and Nesset (2007), and Sirdeshmukh et al. (2002) tested relationships of student satisfaction and loyalty in a traditional education learning in a private institution. The authors suggested that student satisfaction has a positive influence on loyalty. Helgeses and Nesset (2007) determined whether loyalty increases by increasing customer satisfaction. Faizen (2007) found that the dimension of service quality influences student satisfaction, which influences student loyalty. In the research done by Fernandes et al. (2013) on student satisfaction, results indicated a positive impact on student satisfaction with non-academic services and facilities on student loyalty (Fernandes et al., 2013). These studies are some of the few dealing with the relationship between student satisfaction and student loyalty. In the light view of the discussion, the following hypothesis has been developed:
Hypothesis 8: Student satisfaction has a direct, positive, and significant impact on student loyalty.
3. Methodology
The quantitative approach using the survey method was used to collect the data using a self-administered questionnaire administered via an online platform due to the COVID-19 pandemic, which made personal interviews impossible. The purposive sampling technique was used to collect the data from the respondents - who are students in the College of Economics and Management Sciences of a leading ODeL institution in South Africa. A seven-point Likert scale was employed to measure the constructs ranging from ‘1 - strongly disagree’ to ‘7 - strongly agree’. Ethical clearance was obtained from the relevant authorities before the commencement of the study.
3.1. Non-response Bias and Common Method Bias
In the present study, non-response bias was examined by contrasting the survey responses received in the first 14 days of the survey (n=813) against those received after this date. A multivariate statistical technique was applied to examine the null hypothesis of no significant difference between the early and late respondents. The results of this analysis showed no significant difference (Wilks’ lambda = 0.101, p>0.05) between the respondents that completed the survey within the first 14 days and those that completed it after the 14 days. Given these results, non-response bias at critical levels was ruled out.
Moreover, the threat of common method bias was examined using (i) Harman Single Factor technique and (ii) chi-square difference test. The results of the Harman Single Factor test extracted 7 factor-solution for the measurement items. More so, the first fact only extracted 20.92% of the variance, which is less than the commonly accepted threshold of 50%, thus providing initial evidence that data are not affected by CMB. With the chi-square difference, two different factor models were compared. In the first model, the measures were freely permitted to load on their theoretical constructs, whereas in the second model, measures were forced to load on a single factor. The chi-square difference between models was examined. The results show that the one-factor model is significantly worse than the full-factor model (Δχ2 [134] = 1561.653, p < 0.001), thus providing further evidence of the absence of CMB at critical levels.
3.2. Data Analysis and Results
The samples’ and constructs’ descriptive characteristics were analyzed using the Statistical Package for Social Sciences, version 26. Table 1 presents the results of the descriptive characteristics of the sample. Of the 1439 participants, 917 (63.7%) were males, 505 (35.1%) females, and 17(1.2%) undisclosed gender.
Most participants (38.2%) were aged between 21 and 30 years, followed by 37.2% aged between 31 and 40. In total, over two-thirds are aged between 21 and 40. Moreover, 66.1% were Africans, followed by whites (15.45%), coloreds (7.7%), Indians (6.7), and Asians (0.3). Lastly, 36.7% of participants had enrolled for a higher certificate, followed by 32.5% for a bachelor’s degree, 7.6% for an honors degree, 1.3% for a master’s, and 0.6% for a doctoral degree. What is noteworthy is that the sample reflects students of all the major qualifications in the institution.
Table 1. Descriptive Statistics of the sample
| Sample characteristics | Frequency | Percent | |
| Gender | Male | 917 | 63.7 |
| Female | 505 | 35.1 | |
| Prefer not to say | 17 | 1.2 | |
| Age | 18 - 20 years | 57 | 4.0 |
| 21 - 30 years | 549 | 38.2 | |
| 31 - 40 years | 536 | 37.2 | |
| 41 - 50 years | 238 | 16.5 | |
| 51 - 65 years | 59 | 4.1 | |
| Cultural group | African | 951 | 66.1 |
| Asian | 4 | .3 | |
| Colored | 111 | 7.7 | |
| Indian | 97 | 6.7 | |
| White | 222 | 15.4 | |
| I prefer not to say | 54 | 3.8 | |
| Level of qualification | Higher Certificate | 528 | 36.7 |
| Diploma | 308 | 21.4 | |
| Degree | 467 | 32.5 | |
| Honors | 110 | 7.6 | |
| Masters | 18 | 1.3 | |
| PhD/Doctorate | 8 | .6 | |
A partial least squares structural equation (PLS-SEM) technique was used to analyze data to test the research model proposed for the study. The PLS-SEM is a prediction-oriented approach to model testing (Hair et al., 2020). Given that the study aims to predict student’s loyalty to an ODeL institution, PLS-SEM is considered the most appropriate statistical technique. In conducting the analysis to test the model, the study followed a two-step process recommended by Anderson and Gerbing (2017). In following this two-step process, the author of this study examined thevalidity of the measures employed in testing the constructs of this present study. Following the assessment of the measurement model, the structural model was then analyzed to test the hypotheses proposed for the study.
4. Measurement Model Analysis
The analysis of the validity of the measurement model was carried out to assess its convergent validity and discriminant validity. In testing convergent validity, the study used the standardized factor loading, composite reliability, and average variance extracted. According to Hair et al. (2020), for a measurement model to achieve convergent validity, the standardized factor loadings should exceed 0.708. Composite reliability and average variance extracted for the constructs should exceed 0.7 and 0.5, respectively. The results of the convergent validity analysis presented in Table 2 shows that factor loadings for the constructs exceed the 0.708 threshold with 0.733 (CMT3) as the least. More so, the composite reliability for the constructs exceeds the 0.7 cut-off point. Lastly, the AVEs are also above the 0.5 threshold. These results provide evidence to support the convergence validity of the measurement model. Table 2 presents the results for the convergent validity of the measurement model.
After confirming convergent validity, the discriminant validity of the model was subsequently assessed. Two techniques were used to assess discriminant validity. These techniques are addressed in Table 3. The first technique is the Fornell-Larcker (1981) technique. According to this technique, discriminant validity is achieved when the square roots of the AVEs are greater than the inter-construct correlations. The results presented in Table 3 show that the square roots of the AVEs are greater than the inter-construct correlations (estimates below the bold diagonal values). This provides initial evidence of the discriminant validity of the measurement model. The second technique used to assess the discriminant validity of the measurement model is the Heterotrait-Monotrait Ratio (HTMT) of correlation (Henseler et al., 2015). According to the HTMT criterion, discriminant validity is attained when the HTMT ratio of correlations is less than 0.9. The results presented in Table 3 show that all HTMT ratios of correlations obtained for the present study are less than the 0.9 threshold, thus providing further evidence of the discriminant validity of the measurement model. Confirming the validity of the measurement model makes it possible to examine the hypotheses for the study.
Table 2. Convergent validity of the measurement model
| Construct | Factor loading | Composite reliability | Average variance extracted |
| Commitment | 0.903 | 0.652 | |
| CMT1 | 0.754 | ||
| CMT2 | 0.861 | ||
| CMT3 | 0.733 | ||
| CMT4 | 0.849 | ||
| CMT5 | 0.833 | ||
| Loyalty | 0.912 | 0.722 | |
| LOY1 | 0.879 | ||
| LOY2 | 0.889 | ||
| LOY3 | 0.83 | ||
| LOY4 | 0.798 | ||
| Reputation | 0.952 | 0.686 | |
| REP1 | 0.812 | ||
| REP2 | 0.751 | ||
| REP3 | 0.859 | ||
| REP4 | 0.846 | ||
| REP5 | 0.856 | ||
| REP6 | 0.811 | ||
| REP7 | 0.79 | ||
| REP8 | 0.865 | ||
| REP9 | 0.856 | ||
| Satisfaction | 0.965 | 0.848 | |
| SAT1 | 0.903 | ||
| SAT2 | 0.939 | ||
| SAT3 | 0.946 | ||
| SAT4 | 0.916 | ||
| SAT5 | 0.901 | ||
| Service Quality | 0.926 | 0.715 | |
| SQL1 | 0.802 | ||
| SQL2 | 0.878 | ||
| SQL3 | 0.891 | ||
| SQL4 | 0.833 | ||
| SQL5 | 0.821 | ||
| Trust | 0.926 | 0.807 | |
| TRT1 | 0.898 | ||
| TRT2 | 0.919 | ||
| TRT3 | 0.878 | ||
| Value | 0.923 | 0.752 | |
| VLU1 | 0.759 | ||
| VLU2 | 0.908 | ||
| VLU3 | 0.909 | ||
| VLU4 | 0.882 | ||
Table 3. Results of discriminant validity analyses
| 1 | 2 | 3 | 4 | 5 | 6 | 7 | ||
| 1 | Commitment | 0.807 | 0.779 | 0.724 | 0.626 | 0.656 | 0.680 | 0.711 |
| 2 | Loyalty | 0.700 | 0.850 | 0.777 | 0.783 | 0.753 | 0.736 | 0.788 |
| 3 | Reputation | 0.668 | 0.714 | 0.828 | 0.825 | 0.867 | 0.781 | 0.776 |
| 4 | Satisfaction | 0.594 | 0.730 | 0.785 | 0.921 | 0.892 | 0.832 | 0.799 |
| 5 | Service quality | 0.598 | 0.678 | 0.799 | 0.829 | 0.845 | 0.860 | 0.753 |
| 6 | Trust | 0.616 | 0.657 | 0.714 | 0.764 | 0.767 | 0.898 | 0.714 |
| 7 | Value | 0.646 | 0.717 | 0.727 | 0.753 | 0.688 | 0.648 | 0.867 |
Note: *Bold diagonal estimates are the square roots of the AVEs. Values above the diagonal estimates are the HTMT ratio of corrections, and values below are the inter-factor correlations
4.1. Hypotheses Testing
Before testing the hypotheses for the study, collinearity among the independent constructs was examined using the VIF values. According to Hair et al. (2020), collinearity is not a problem when the VIF values are less than 3. The VIF values estimated for the present study ranged from 1 to 2.957. Given that these VIF values are less than 3, collinearity does not present a significant threat to the constructs of the study.
The assessment of the hypotheses entailed the analysis of the size and significance of the path coefficients, the size effect (f2) of the relationship, and the R2 of the endogenous variable. Presented in Table 3 and figures 2 and 3 are the results of the hypotheses testing.
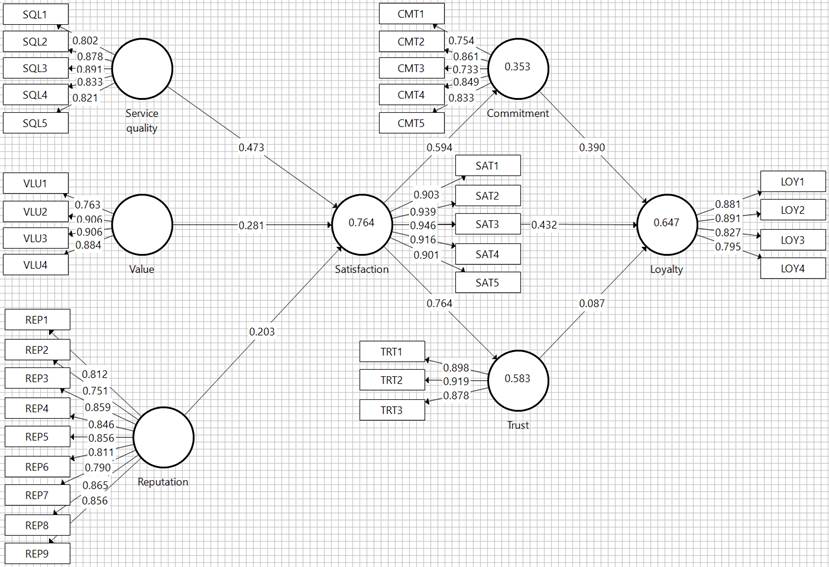
Figure 2. Results of the PLS-SEM analysis with outer weights, path coefficients, and R2
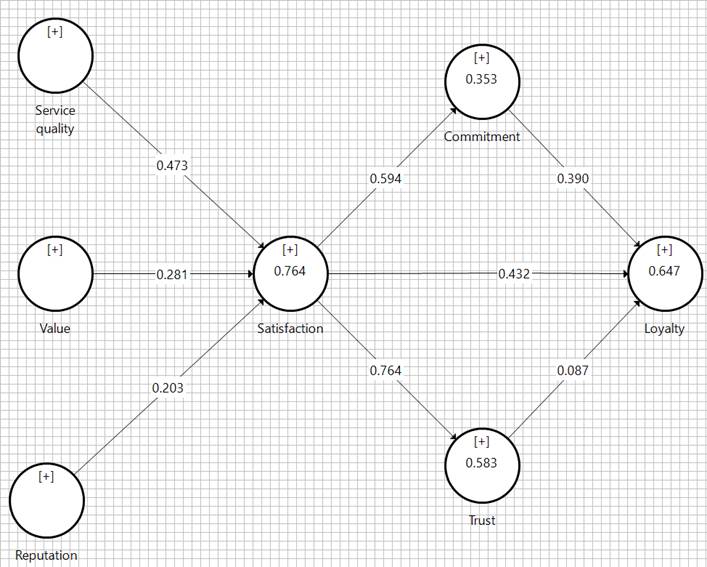
Figure 3. Results of the PLS-SEM analysis with outer weights, path coefficients, and R2
Table 4. Hypotheses testing for direct relationships
| Hypotheses | Path coefficient | Result | f2 | Size effect | ||
| H1 | Service quality → Satisfaction | 0.473* | [0.408; 0.525] | Supported | 0.319 | medium |
| H2 | Value → Satisfaction | 0.281* | [0.230; 0.326] | Supported | 0.147 | Small |
| H3 | Reputation → Satisfaction | 0.203* | [0.143; 0.267] | Supported | 0.052 | small |
| H4 | Satisfaction → Commitment | 0.594* | [0.553; 0.634] | Supported | 0.546 | Large |
| H5 | Satisfaction → Loyalty | 0.432* | [0.369; 0.499] | Supported | 0.207 | medium |
| H6 | Trust → Loyalty | 0.087** | [0.027; 0.140] | Supported | 0.008 | Weak effect |
| H7 | Satisfaction → Loyalty | 0.432* | [0.369; 0.499] | Supported | 0.207 | medium |
| H8 | Commitment → Loyalty | 0.390* | [0.323; 0.457] | Supported | 0.252 | medium |
Note: *p<0.001, **p<0.01; f2 (size effect); estimates above 0.35= large effect; 0.15 – 0.35 = medium effect and 0.02 – 0.15 small effect (Cohen, 1998).
The analyses show that students’ perceived service quality of the ODeL institution has a significant positive impact on their satisfaction with the institution (β=0.473, p<0.001), thus supporting hypothesis 1. The effective size of the service quality-satisfaction relationship is medium. With regard to H2, the results show that students’ perception of value has a significant positive effect on satisfaction (β=0.203, p<0.001), thus providing statistical support for H2. However, the size effect is small. Relatedly, perceived institutional reputation has a significant and positive effect on student’s satisfaction (β=0.203, p<0.001). This provides support for H3. However, the size effect of this relationship is small. The results further suggest that students’ satisfaction with the ODeL institution has a significant impact on their commitment to the institution (β=0.594, p<0.001) and loyalty toward the institution (β=0.432, p<0.001). These results provide support for H4 and H5. However, while the size effect for the satisfaction-commitment relationship is large, that of the satisfaction–loyalty relationship is medium. The results of the analyses further show that students’ loyalty to the ODeL institution is further predicted by their trust toward the institution (β=0.087, p<0.05) and satisfaction with the institution (β=0.432, p<0.001), and commitment to the ODeL institution (β=0.390, p<0.001), thus providing statistical support for H6, H7, and H8. However, although trust satisfaction and commitment have significant effects on loyalty, the size effect of the trust-loyalty relationship is weak, whereas it is medium for those of the commitment-loyalty and satisfaction–loyalty relationships.
In terms of the R2 values estimated for the endogenous constructs in the model, the results show that 76.4% of the variance in student’s satisfaction with the ODeL institution is explained by their perception of service quality, value, and reputation of the institution. Furthermore, satisfaction explains 35.3% and 58.3% of the variance in commitment and trust, respectfully. Lastly, satisfaction, trust, and commitment explain 64.7% of the variance in student’s loyalty to the ODeL institution.
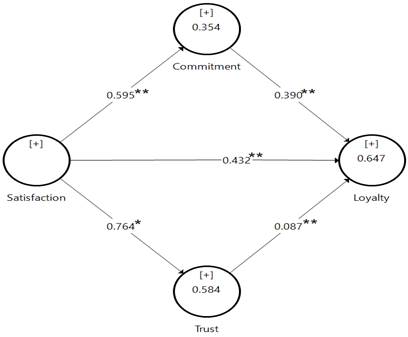
The study also determines the mediating role of trust and commitment on the satisfaction–loyalty link. In conducting the mediating analysis, the author followed the procedure recommended by Klarner et al. (2013) to test two mediators (commitment and trust). Four models were estimated. The results of this analysis are presented in Figure 4 and Table 5.
|
|
||
| Model 1: Direct effect | Model 2a: Model with first mediator– commitment | ||
|
|
||
| Model 2b: Model with the second mediator - trust | Model 3: Model with both mediators |
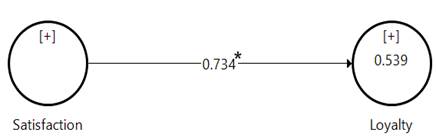
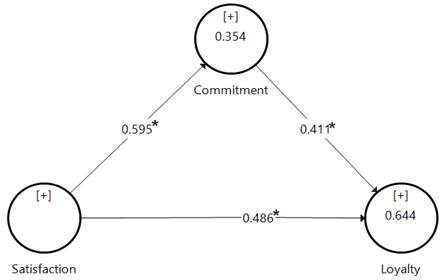
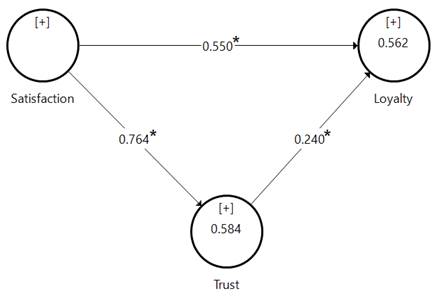
Figure 4. Models for mediation analysis
In Model 1, the direct relationship between satisfaction and loyalty was estimated. The results show that satisfaction has a strong direct effect on loyalty (β=.734; p<0.001). In model 2a, the mediator, commitment, was included in the satisfaction–loyalty relationship. The results show that satisfaction has a significant indirect effect (through commitment) on loyalty β=0.245; p<0.001). Although the inclusion of the mediator (commitment) reduces the strength of the direct effect, it remains significant (β=0.486; p<0.001) with a variance accounted for (VAF) of 36.19%, which exceeds the recommended threshold of 20% (Hair et al., 2017). These results show that commitment partially mediates the satisfaction–loyalty relationship. In model 2b, the media, trust was introduced into the satisfaction–loyalty relationship. The indirect effect of satisfaction on loyalty via trust is significant (β=0.183; p<0.001), while at the same time, the direct effect is also significant (β=0.550; p<0.001) with a VAF of 24.95%, thus providing evidence of a partial mediation of trust on the satisfaction–loyalty relationship. In Model 3, both mediators (commitment and trust) were simultaneously included in the satisfaction–loyalty relationship. The results show that the indirect effect of satisfaction on loyalty via commitment and trust is significant (β=0.183; p<0.001) while the direct effect of satisfaction on loyalty remains significant (β=0.550; p<0.001) with a computed VAF of 40.86%. Thus, a consideration of the overall mediation results generally suggests that commitment and trust partially mediate the satisfaction–-loyalty relationship, providing statistical support for H8.
Table 5.Results of mediation analysis
| Direct | Indirect | Total | VAF | Mediation? | |
| Model 1 | 0.734* | ||||
| Model 2a | 0.486* | 0.245* | 0.677 | 36.19% | Yes, partial |
| Model 2b | 0.550* | 0.183* | 0.733 | 24.97% | Yes, partial |
| Model 3 | 0.432* | 0.298* | 0.730 | 40.82% | Yes, partial |
5. Discussions and Conclusion
One of the objectives of this study was to develop a framework for attaining student loyalty in an ODeL institution. From the findings of the study, all the constructs positively and significantly correlate with each other. In addition, all independent variables, including mediating variables, contribute significantly to student Loyalty. Hence, all the hypotheses of this study are accepted, and the conceptual framework, as shown in figure 1, is adapted. This study revealed that student satisfaction with the ODeL institution has a significant impact on students’ commitment to the institution (β=0.594, p<0.001), and institution reputation has a direct impact on student loyalty (β=0.432, p<0.001). This is in line with Helgesen and Nesset (2007), who found that the effect of satisfaction on loyalty is significant. Service quality exerts a strong positive effect on students’ satisfaction in support of Faizan et al. (2016), who stated that satisfaction is largely influenced by service quality within the ODeL sector. The size effect of the trust-loyalty relationship is weak, contrasting the findings of Martnez and Del Bosque (2013) that state that trust has a significant positive impact on customer loyalty.
The major academic contribution of this study is that it has innovated a comprehensive framework of student loyalty that can be implemented in ODeL institutions in their quest to achieve student loyalty. Secondly, trust, according to Wilson (1995), is a fundamental relationship model building block and, as such, is included in most relationship models. In contrast, this study shows that trust has a weak effect on student loyalty. Moreover, this study illustrates that, although the constructs under study are correlated and related, there exist differences in their strength of influence.
To achieve student loyalty in ODeL institutions, management can ensure loyalty behaviors by improving students’ perceptions, value creation, and strategies for achieving a good institutional reputation. These can include branding, being student-centered, providing service quality on-time, and improving communication. Accordingly, universities should ensure that necessary internal processes are put in place to meet students’ expectations with respect to higher education learning outcomes. Recognizing that students’ service quality is central to learning (Harvey and Green, 1993; Mezirow, 2006), universities should improve on the technical aspects of service quality.
One of the limitations of the study is that it was carried out at one particular public higher education institution, which uses the open and distance electronic learning concept. Therefore, this limitation limits the generalizability of the findings.To improve the generalizability of the findings, future studies can consider other private or international public ODeL and conventional higher institutions. Future studies can make use of mixed methods in order to have an in-depth understanding of how students perceive certain variables.
References
- Akinci, S., Kiymalioglu , A. and Inana, E. A., 2015. How golf players’ satisfaction from golf experience predicts their loyalty intentions? Mediating role of perceived value. International Journal of Culture, Tourism and Hospitality, 9(2), pp. 117-132.
- Alves, H. and Raposo, M., 2007. Conceptual model of student satisfaction in higher education.Total Quality Management and Business Excellence, 18(5), pp. 571-588.
- Ansari, A., and Sanayei, A., 2012. Determine the effects of mobile technology, mobile learning on customer satisfaction and loyalty (Case study: Mellat Bank). International Journal of Information Science and Management (IJISM), pp. 137-152.
- Ayuni, D., and Mulyana, A., 2019. Applying Service Quality Model as a Determinant of Success in E-learning: The Role of Institutional Support and Outcome Value. Review of Integrative Business and Economics Research, 8, pp. 145-159.
- Bolton R., and Drew, J., 1991. A multistage model of customer’s assessments of service quality and value// Journal of Consumer Research, 17(4), pp. 375-384.
- Brady, M. K., Cronin, J. J., and Brand, R. R. 2002. Performance-only measurement of service quality: A replication and extension. Journal of Business Research, 55(1), 17–31.
- Brochado, A., 2009. Comparing alternative instruments to measure service quality in higher education. Quality Assurance in Education, 17(2), pp. 174-190.
- Brokaw, A. J., Kennedy, W. A. and Merz, T. E. 2004. Explaining Student Satisfaction. Journal of the Academy of Business Education, pp. 62–72.
- Chandra, T., Martha, N., Chandra, S., and Priyono, P. 2018. The Effect of Service Quality on Student Satisfaction and Student Loyalty: An Empirical Study. Journal of Social Studies Education Research, 9(3), 109–131
- Chen, Y.C., 2017. The relationships between brand association, trust, commitment, and satisfaction of higher education institutions. International Journal of Educational Management.
- Chiou, J., Pan, L., 2009. Antecedents of internet retailing loyalty: differences between heavy versus light shoppers. Journal of Business and Psychology, 24 (3), pp. 327–339.
- Churchill, G. A., Jr. and Surprenant, C. 1982. An Investigation into the Determinants of Customer Satisfaction. Journal of Marketing Research, 491-504.
- Cronin, J. J., Brady, M., and Hult, G. T. M. 2000. Assessing the effects of quality, value and customer satisfaction on consumer behavioral intentions in service environments. Journal of Retailing, 76(2), 193–218.
- Dana, S. W., Brown, F. W. and Dodd, N. G. 2001. Student perception of teaching effectiveness: A preliminary study of the effects of professors' transformational and contingent reward leadership behaviors. Journal of Business Education, 2, pp. 53-70.
- de Oliveira Santini, F., Junior Ladeira, W., Hoffmann Sampaio, C. and da Silva Costa, G. 2017. Student satisfaction in higher education: a meta-analytic study. Journal of Marketing for Higher Education, 27(1), pp.1–18
- Dovaliene, A., Masiulyte, A. and Piligrimiene, Z., 2015. The relations between customer engagement, perceived value and satisfaction: the case of mobile applications. Procedia-Social and Behavioral Sciences, 213, pp.659-664.
- Elliot, K.M. and Healy, M.A., 2001. Key factors influencing student satisfaction related to recruitment and retention. Journal of Marketing for Higher Education, 10(4), pp. 1–11.
- Endah, P.E., Umar, N., Suharyono, S. and Andriani, K., 2017. Study on destination image, satisfaction, trust and behavioral intention. Russian Journal of Agricultural and Socio-Economic Sciences, 61(1), pp. 148-159.
- Esterhuizen, H., 2015. Technology Enhanced Learning in Open Distance Learning at NWU. The Turkish Online Journal of Educational Technology, 14 (3), pp. 120-137.
- Faizan, A., 2016. Does higher education service quality effect student satisfaction, image and loyalty? A study of international students in Malaysian public universities. Quality Assurance in Education, 24(1), pp. 70-94.
- Firdaus, A., 2005. HEdPERF versus SERVPERF: The quest for ideal measuring instrument of service quality in higher education sector. Quality Assurance in Education, 13(4), pp. 305-328.
- Fornell, C., and Larcker, D.F. 1981. Evaluating structural equation models with unobservable and measurement error. Journal of Marketing Research, 18(1), 39–50.
- Goolamally, N., and Latif, L. A., 2014a. Determinants of student loyalty in an open distance learning institution. In Seminar Kebangsaan Pembelajaran SepanjangHayat, 390-400.
- Goolamally, N., and Latif, L. A., 2014b. Validating the student loyalty model for an open distance learning institution. ASEAN Journal of Open and Distance Learning (AJODL), 6(1), pp. 78-88.
- Guilbault, M., 2016. Students as customers in higher education: reframing the debate. Journal of Marketing for Higher Education, 26(2), pp. 132-142.
- Hair Jr, J. F., 2020. Next-generation prediction metrics for composite-based PLS-SEM. Industrial Management and Data Systems, 121(1), pp. 5-11.
- Hair, J. F., Hult, G. T. M., Ringle, C. M., and Sarstedt, M., 2017. A primer on partial least squares structural equation modeling (PLS-SEM) (2nd ed.). Thousand Oaks, CA: Sage.
- Hair, J.F., Hult, G.M., Ringle, C.M., and Sarstedlt, M. 2017. A primer on partial least squares structural modelling (PLS-SEM). New Jersey, USA: Sage Publication, Inc.
- Hakim, L. and Hidayat, A.S., 2018. The effect of job stress and job satisfaction on organizational commitment. Indonesian Journal of Business and Economics, 1(1), pp. 110-119.
- Han, H., and Hyun, S. S., 2015. Customer retention in the medical tourism industry: Impact of quality, satisfaction, trust and price reasonableness. Tourism Management, 46, pp. 20–29.
- Helgesen, O. and Nesset, E. 2007a. Images, satisfaction, and antecedents: Drivers of student loyalty? A case of a Norwegian College. Corporate Reputation Review, 10(1), pp.38-59.
- Helgesen,O. and Nesset, E., 2007b. What accounts for students’ loyalty? Some field study evidence. International Journal of Educational Management, 21(2), pp. 126-143.
- Helgesen, O., and Nesset, E., 2007c. Images, satisfaction and antecedents: Drivers of student loyalty? A case study of a Norwegian university college. Corporate Reputation Review, 10(1), pp. 38–59.
- Henning-Thurau,T., Lager, M.F. and Hansen, U., 2001. Modelling and managing student loyalty: an approach based on the concept of relationship quality. Journal of Service Research, 3(1), pp. 331-44.
- Henseler, J., Ringle, C. M., and Sarstedt, M 2015. A new criterion for assessing discriminant validity in variance-based structural equation modeling. Journal of the Academy of Marketing Science, 43(1), pp. 115-135
- Kunanusorn, A. and Puttawong, D.D., 2015. The mediating effect of satisfaction on student loyalty to higher education institution. European Scientific Journal, 1, pp. 449-463.
- Lai, S.L., Pham, H.H. and Le, A.V., 2019. Toward sustainable overseas mobility of Vietnamese students: understanding determinants of attitudinal and behavioral loyalty in students of higher education. Sustainability, 11(2), p. 383.
- Marimo, S.T., Mashingaidze, S. and Nyoni, E 2013. Faculty of Education Lecturers’ and students. Journal of Marketing, 58(3), pp. 20-38.
- Martínez, P. and Del Bosque, I.R., 2013. CSR and customer loyalty: The roles of trust, customer identification with the company and satisfaction. International Journal of Hospitality Management, 35, pp.89-99.
- Martínez, A.M. Batalla. B., 2016. Perceived Service Quality and Student Loyalty in an Online University. The International Review of Research in Open and Distributed Learning, 17(4), pp.264-279.
- Masserini, L., Bini, M. and Pratesi, M., 2019. Do quality of services and institutional image impact students’ satisfaction and loyalty in higher education? Social Indicators Research, 146(1-2), pp. 91-115.
- McDougall, G. H. and Levesque, T., 2000. Customer satisfaction with services: putting perceived value into the equation. Journal of Services Marketing, 14(5), pp. 392-410.
- Morgan, R.M. and Hunt, S.D., 1994. The commitment-trust theory of relationship marketing. Journal of Marketing, 58(3), pp. 20-38.
- Mpinganjira, M., Bogaards, M., Svensson, G., and Mysen, T. 2014. Precursors and outcomes of satisfaction in business relationships: A replication study. Management Dynamics, 23(2), pp. 2–13.
- Mpinganjira, M., Roberts-Lombard, M. and Svensson, G., 2017. Validating the relationship between trust, commitment, economic and non-economic satisfaction in South African buyer-supplier relationships. Journal of Business & Industrial Marketing. 32(3), pp. 421-431.
- Nadiri, H., Kandampully, J. and Hussain, K., 2009. Students’ perceptions of service quality in higher education. Total Quality Management & Business Business, 20(5), pp. 523-535.
- Nasution, M.I., Prayogi, M.A., Jufrizen, D.R.P. and Juliandi, A., 2019, November. Compensation and Organizational Commitment: The Mediating Role of Job Satisfaction. In ICASI 2019: Proceedings of The 2nd International Conference On Advance And Scientific Innovation, ICASI 2019, 18 July, Banda Aceh, Indonesia (p. 396-403). European Alliance for Innovation.
- Oliver, R. L., 1999. Whence Consumer Loyalty? Journal of Marketing, 63(Special Issue), pp. 33-44.
- Oliver, R.L. 1997. Satisfaction: A Behavioural Perspective on the Consumer. New York, NY, USA: McGraw Hill.
- Orozco Encinas, C. F. and Cavazos Arroyo, J. 2017. Students’ loyalty in Higher Education: the roles of affective commitment, service co-creation and engagement. Journal of Management, 33(57), 96–110.
- Parasuraman, A., Zeithaml, V. and Berry, L. 1988. SERVQUAL: a multiple-item scale for measuring customer expectations of service quality. Report No. 86 – 108, Marketing Science Institute, Cambridge, MA.
- Patterson, P. G. and Spreng, R. A., 1997. Modelling the relationship between perceived value, satisfaction and repurchase intentions in a business-to-business, services context: an empirical examination. International Journal of Service Industry Management, 8(5), pp. 414-434.
- Pham, L., Limbu, Y.B., Bui, T.K., Nguyen, H.T. and Pham, H.T 2019. Does e-learning service quality influence e-learning student satisfaction and loyalty? Evidence from Vietnam. International Journal of Educational Technology in Higher Education, 16(1), pp. 1-26.
- Rather, R.A. and Sharma, J., 2017. The effects of customer satisfaction and commitment on customer loyalty: Evidence from the hotel industry. JOHAR, 12(2), 41-60.
- Rodić Lukić, V. and Lukić, N 2018. Assessment of student satisfaction model: evidence of Western Balkans. Total Quality Management and Business Excellence,1-13.
- Rojas J.I., Kara, A., and Cerda, A. 2009. Determinants of Student Loyalty in Higher Education: A Tested Relationship Approach in Latin America. Journal Latin American Business Review, 10(1), pp. 21-39.
- Samudro, A., Sumarwan, U., Simanjuntak, M. and Yusuf, E.Z., 2019. How commitment, satisfaction, and cost fluctuations influence customer loyalty. Samudro, A, pp.115-125.
- Sirdeshmukh, D., Singh, J. and Sabol, B., 2002. Consumer Trust, Value, and Loyalty in Relational Exchanges. Journal of Marketing, 66(1), pp. 15-37.
- Shahsavar, T. and Sudzina, F., 2017. Student satisfaction and loyalty in Denmark: Application of EPSI methodology. PloS one, 12(12), p.e0189576. doi: 10.1371/journal.pone.0189910
- Stokes, S. P. 2003. Temperament, learning styles, and demographic predictors of college student satisfaction in a digital learning environment. Biloxi, MS: Mid-South Educational Research Association. (ERIC Document Reproduction Service No. ED482454).
- University of South Africa. 2019. Open Distance Learning (ODL) is a different way of learning. [online] Available at: https://www. unisa.ac.za/sites/corporate/default/Apply-for-admission/ Honours-degrees-&-postgraduate-diplomas/ODL-Unisaand-postgraduate-studies/Open-Distance-Learning-(ODL)-isa-different-way-of-learning. [Accessed on 19 April 2021].
- Weirs, J., Stensaker, B., and Grogaard, J., 2002. Student satisfaction: Towards an empirical deconstruction of the concept. Quality in Higher Education, 8(2), pp. 183-196.
- Wong, A., Tong, C. and Wong, J.W 2017. The relationship between institution branding, teaching quality and student satisfaction in higher education in Hong Kong. Journal of Marketing and HR, 4(1), pp. 169-188.
- Wu, B 2014. Identifying the influential factors of knowledge sharing in e-learning 2.0 systems. International Journal of Enterprise Information Systems, 12(1), pp. 85–102.
- Xiao, J. and Wilkins, S 2015. The effects of lecturer commitment on student perceptions of teaching quality and student satisfaction in Chinese higher education. Journal of Higher Education Policy and Management, 37 (1), pp. 98-110.
- Yuksel, E., Graham, M. R., and Philip, D. L., 2008. An extended model of the antecedents and consequences of consumer satisfaction for hospitality services. European Journal of Marketing, 42(1/2), pp.35–68.
Article Rights and License
© 2021 The Author. Published by Sprint Investify. ISSN 2359-7712. This article is licensed under a Creative Commons Attribution 4.0 International License.